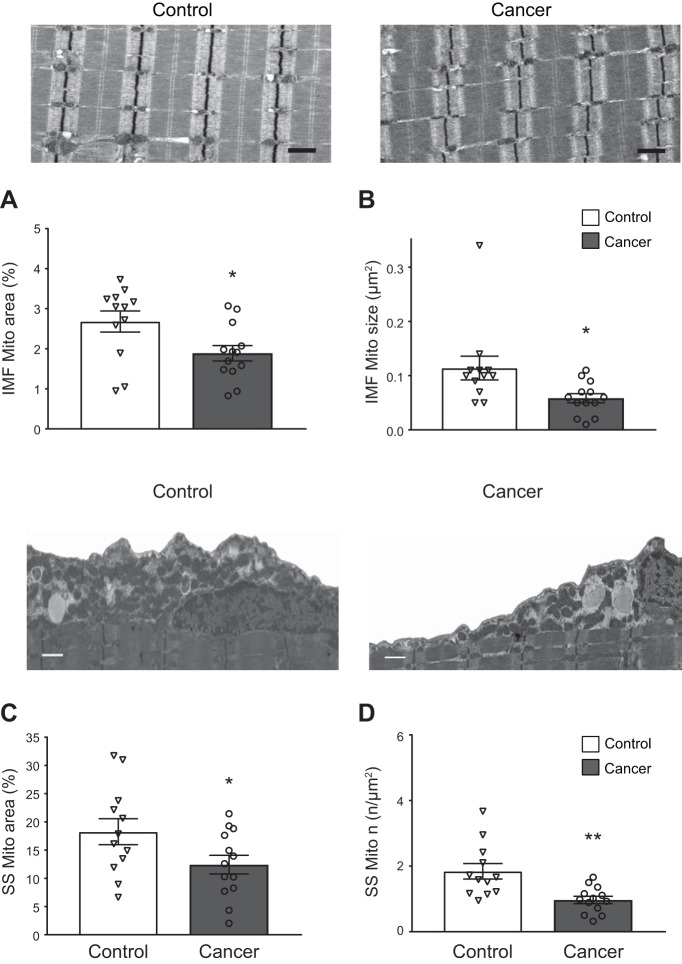
Fig. 2.
Skeletal muscle mitochondrial (Mito) content and structure in intermyofibrillar (IMF) and subsarcolemmal (SS) compartments. Representative images for IMF mitochondrial fractional area for controls and cancer patients are shown above A and B, respectively, with average IMF mitochondrial fractional area (A) and average size (B) for controls and breast cancer patients. Representative images for SS mitochondria for controls and cancer patients are shown above C and D, respectively, with average SS fractional area (C) and average number (n) per unit SS area (D). Scale bars = 1 µm for all images. Values are means ± SE, with individual data points shown with each bar. For A–D, multiple observations within each individual were averaged to provide a single data point for each individual. *P < 0.05, **P < 0.01 vs. control.

