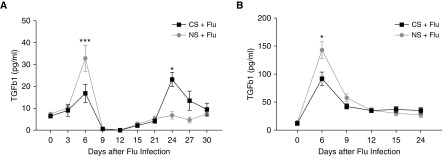
Figure 3.
CS exposure caused different levels of transforming growth factor β (TGF-β) in BAL fluid after influenza infection. The levels of TGF-β were measured in the BAL samples of CS-exposed and influenza-infected mice at the indicated time points. (A and B) Total TGF-β levels (A) and active TGF-β levels (B) in BAL fluid; n = >4 mice in each group at each time point. The data represent the mean ± SD for a minimum of four mice at each time point. Data are from one of at least two independent experiments. *P < 0.05; ***P < 0.001 comparing CS and NS groups at the same time point.

