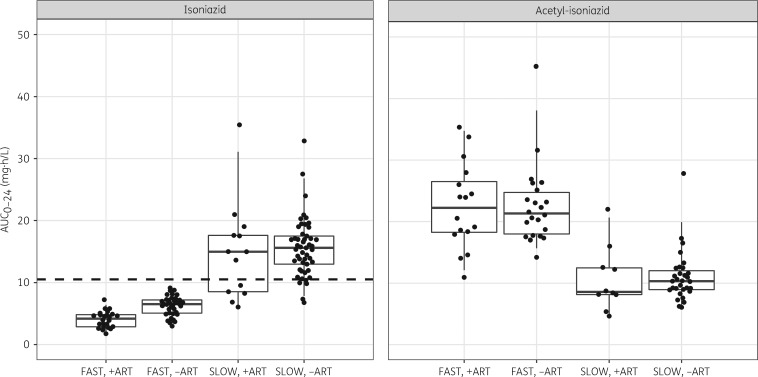
Figure 3.
Boxplots of AUC0–24 for isoniazid and acetyl-isoniazid stratified by treatment arm (receiving efavirenz-based ART versus no ART) and NAT2 metabolizer status. The dots are model-derived individual exposures (steady-state AUC0–24). The dashed line represents the exposure (AUC0–24 = 10.52 mg·h/L) associated with 90% early bactericidal activity of isoniazid.4

