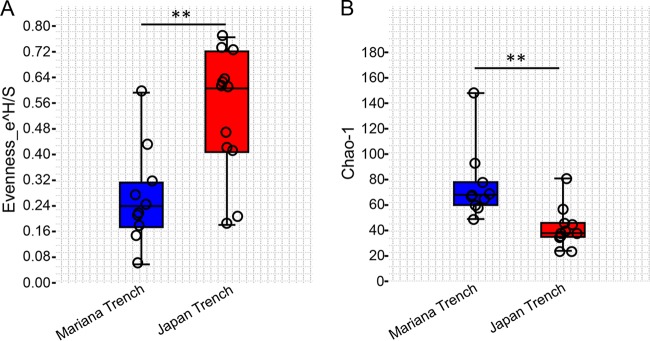
FIG 3.
Alpha diversity of the gut microbiota based on genera composition and relative abundance. Evenness (A) and Chao (B) indexes are displayed by box and jitter plot. ** indicates a significant difference (two-tailed Student’s t test following a Shapiro-Wilk test to confirm the normal distribution of these data; P < 0.01) between the gut microbiota of the two H. gigas populations.

