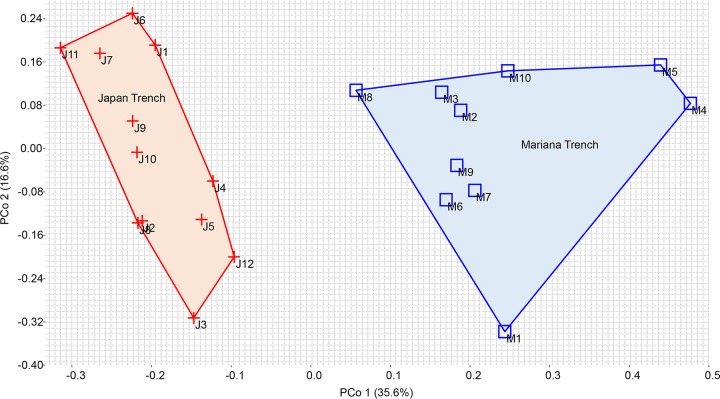
FIG 4.
Beta diversity of the gut microbiota from different H. gigas individuals. Bray-Curtis distances were calculated based on the genus composition and relative abundance and visualized through PCoA. Eigenvalues (percentages of variance for the first two principal components) are shown in the figure. The lines around the samples are convex hulls. Significant difference of genus composition between the two sites was confirmed by one-way nonparametric multivariate analysis of variance (NPMANOVA) (F = 7.627, P = 0.0001).

