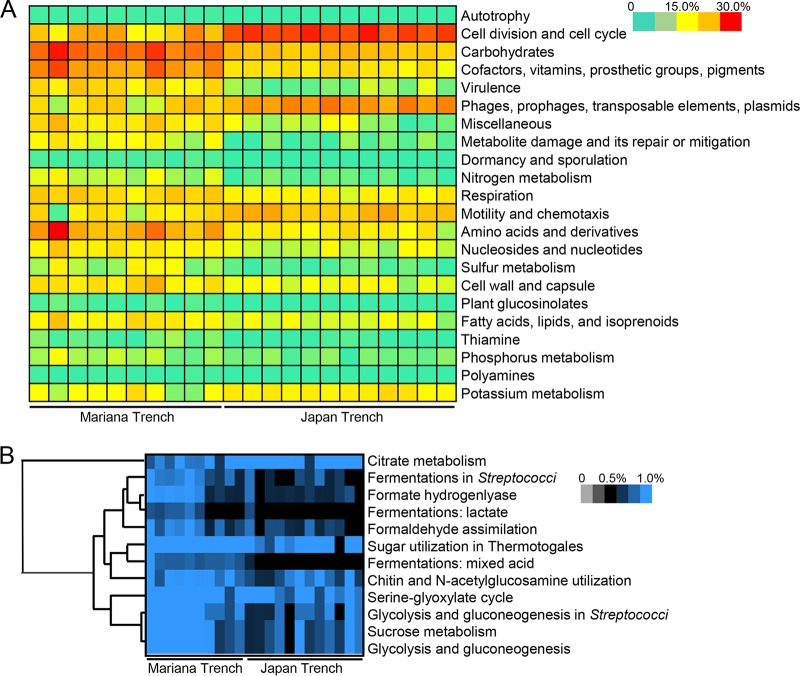
FIG 6.
Metabolic profiles of the gut microbiota based on SEED classification. (A) Significantly changed (two-tailed Student’s t test following a Shapiro-Wilk test to confirm the normal distribution of these data; P < 0.01) functional potentials, as revealed by the functional profile at SEED1 level. (B) Significantly changed SEED2 functional potentials belonging to the carbohydrate metabolism category. In total, 12 functional potentials showed significant changes between the gut microbiota of the two H. gigas populations, and 11 of them had higher abundance in the Mariana Trench H. gigas population.

