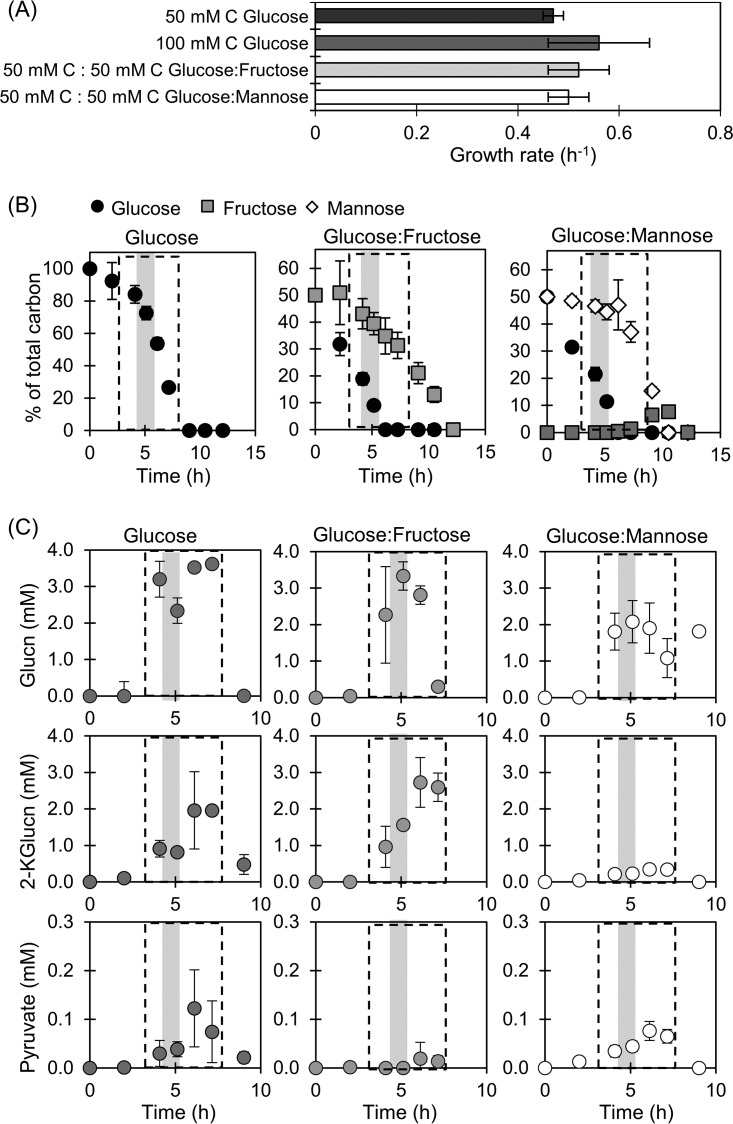
FIG 2.
Growth rates (A), kinetic profiles of carbohydrate depletion (B), and kinetic profiles of metabolite secretions (C) for cells grown on glucose alone, on an equimolar mixture of glucose and fructose, or on a mixture of glucose and mannose. Initial total carbon-equivalent carbohydrate concentration was 100 mM C (or 3 g·liter−1 substrate concentration). In panels B and C, the dashed boxes designate when data points were obtained during exponential growth; the shaded gray areas at an OD600 of 0.5 correspond to the time points for the measured labeling data used in the MFA. Data (average ± standard deviation) are from independent biological replicates (n = 3).

