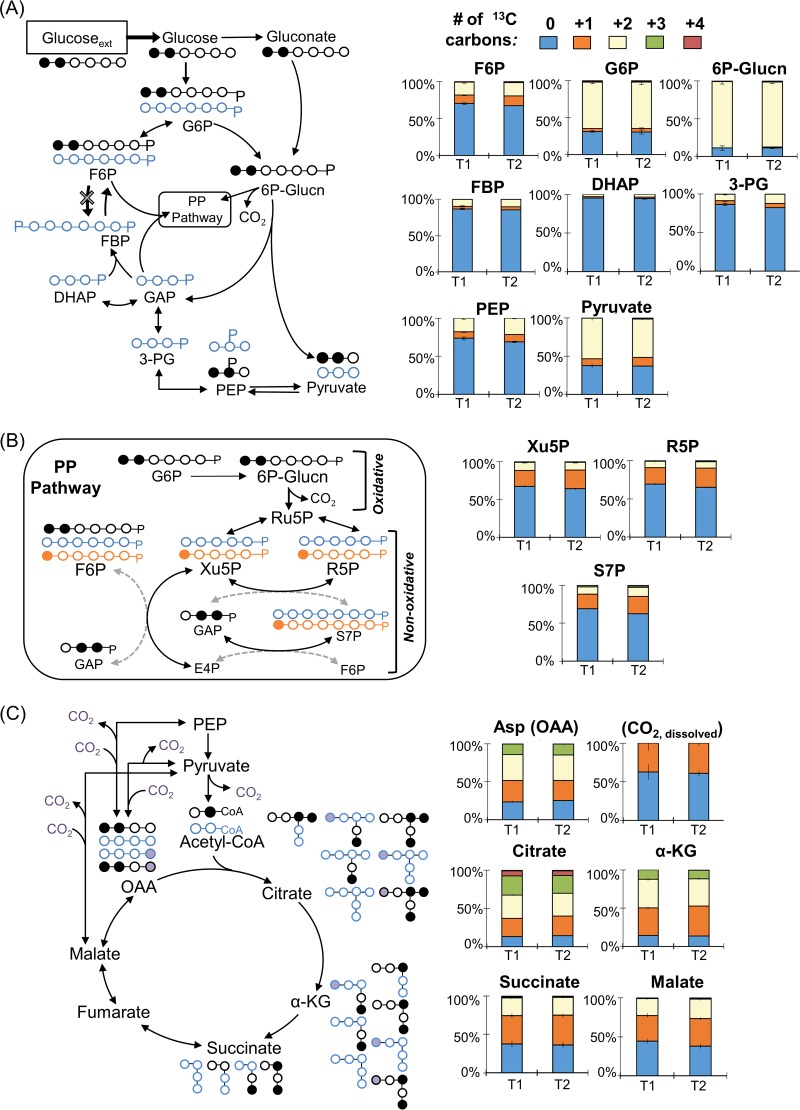
FIG 3.
Long-term isotopic enrichment with [1,2-13C2]glucose for carbon mapping of the metabolic network structure in P. protegens Pf-5. Carbon mapping is illustrated on the left and the metabolite labeling data are provided on the right for the following: (A) Initial glucose catabolism, Embden-Meyerhof-Parnas (EMP) pathway, and the Entner-Doudoroff (ED) pathway; (B) oxidative and non-oxidative routes of the pentose-phosphate (PP) pathway; (C) the tricarboxylic acid (TCA) cycle. The dashed arrows describe minor formation routes of the metabolites. In the carbon mapping on the left, 13C carbons directly from glucose are in black, nonlabeled carbons from the ED pathway are in blue, singly 3C-labeled metabolites originated from the oxidative PP pathway are in orange, and the addition of labeled CO2 is shown by purple circles. Metabolite labeling patterns in panels A to C: nonlabeled (light blue), singly labeled (orange), doubly labeled (cream), triply labeled (green), and quadruply labeled (red). Labeling data (average ± standard deviation) were from independent biological replicates (n = 3). G6P, glucose 6-phosphate; 6P-Glucn, 6-phosphogluconate; F6P, fructose 6-phosphate; FBP, fructose 1,6-bisphosphate; DHAP, dihydroxyacetone-3-phosphate; GAP, glyceraldehyde 3-phosphate; PEP, phosphoenolpyruvate; 3-PG, 3-phosphoglycerate; Xu5P, xylulose 5-phosphate; R5P, ribose 5-phosphate; S7P, sedoheptulose 7-phosphate; OAA, oxaloacetate; Asp, aspartate; α-KG, α-ketogluconate.

