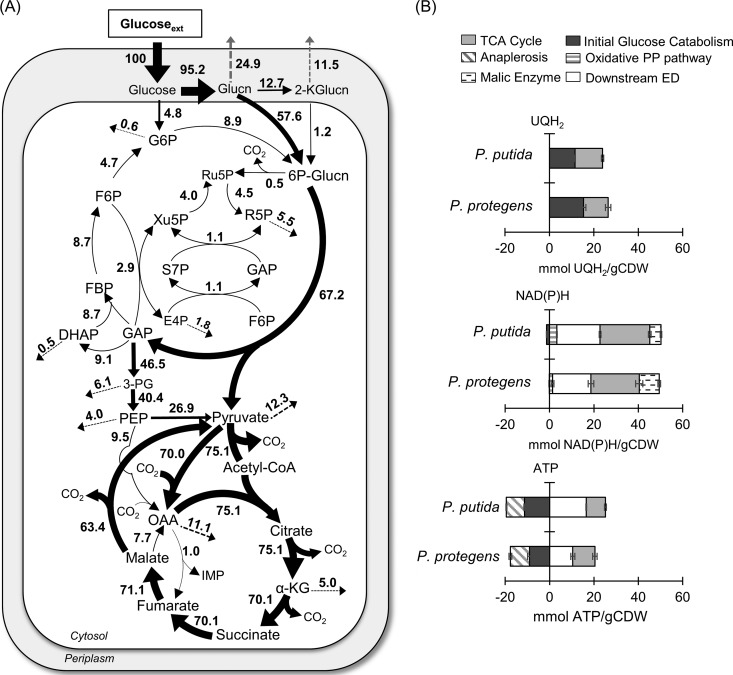
FIG 4.
Quantitative metabolic flux analysis (A) and energetic distributions (B) in glucose-grown P. protegens Pf-5. All fluxes were normalized to glucose uptake, and the thickness of each arrow is scaled to the relative flux percentage. For panel A, black dotted arrows indicate contribution to biomass and gray dashed arrows indicate metabolite secretions. The absolute fluxes (average ± standard deviation), optimized on data obtained from independent biological replicates (n = 3), are listed in Table S3 and S4. Abbreviations in panel A are as listed in the legend of Fig. 3. For panel B, the relative contributions of different pathways to the NAD(P)H, UQH2, and ATP pools were calculated from metabolic fluxes. Data for P. putida KT2440 were obtained from the metabolic flux analysis reported in Nikel et al. (10). All values in panel B are relative to glucose consumption rate and cellular biomass.

