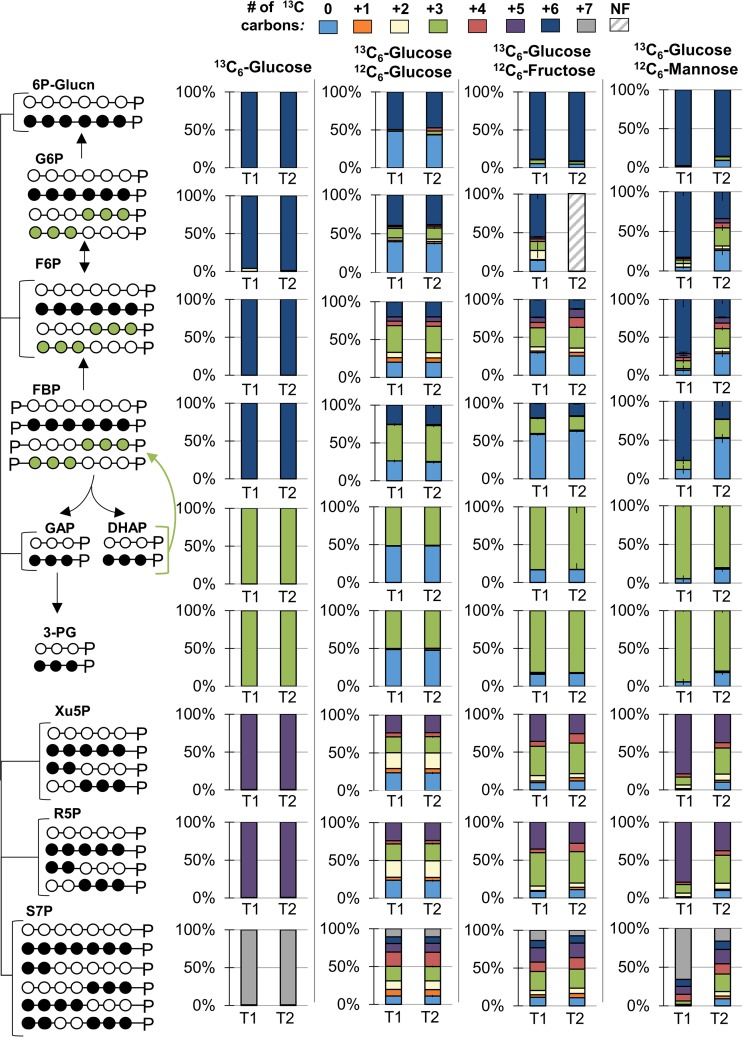
FIG 6.
Metabolite labeling patterns during growth on [U-13C6]glucose (13C6-Glucose) alone or with unlabeled glucose (12C6-Glucose), unlabeled fructose (12C6-Fructose), or unlabeled mannose (12C6-Mannose). Carbon mapping (left) and the labeling data (right) for intracellular metabolites in the upper Embden-Meyerhof-Parnas (EMP) pathway, the pentose-phosphate pathway, and the Entner-Doudoroff pathway. The open circles and the filled circles represent nonlabeled and 13C-labeled carbons, respectively; the green circles represent labeling schemes specifically from reverse flux through upper EMP pathway. Data were obtained at two time points during exponential growth: at OD600 of 0.5 to 0.6 (T1) and at OD600 of 0.9 to 1.0 (T2). NF, not found. Labeling data (average ± standard deviation) were from independent biological replicates (n = 3). Very small error bars are not noticeable. The abbreviations are as listed in the legends for Fig. 1 and 3.

