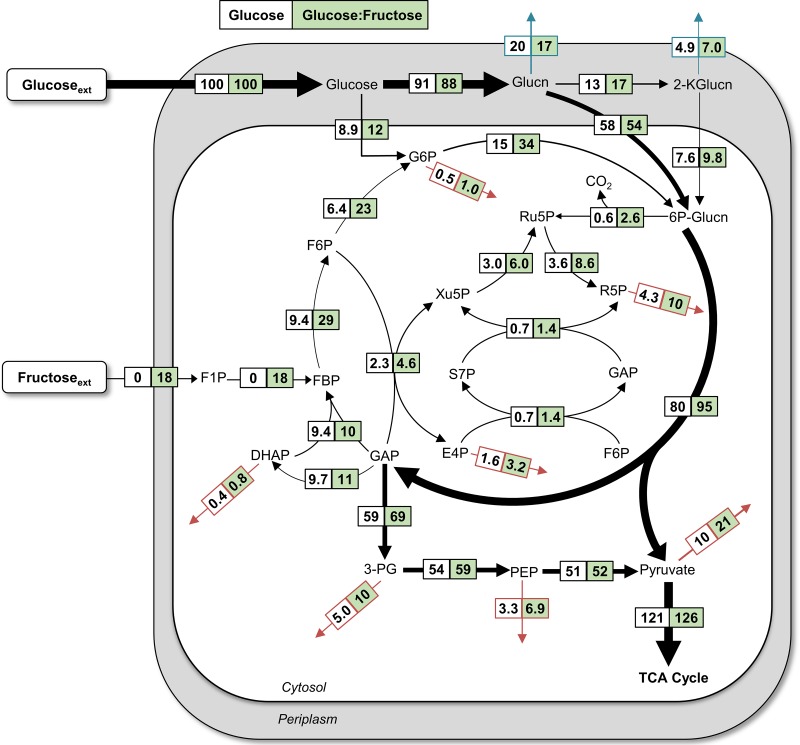
FIG 7.
Quantitative metabolic flux analysis of P. protegens Pf-5 using metabolite labeling data following growth on [U-13C6]glucose and unlabeled glucose (white) or [U-13C6]glucose and unlabeled fructose (green). All fluxes were normalized to 100% glucose uptake, and the thickness of each arrow was scaled to the relative flux percentage for the glucose-only growth condition. Red arrows indicate contribution to biomass and blue arrows indicate excretion fluxes. The metabolite abbreviations are as listed in the legends for Fig. 1 and 3. The absolute fluxes (mean ± standard deviation), which were obtained by modeling experimental labeling data from three biological replicates, are listed in Tables S5 and S7.

