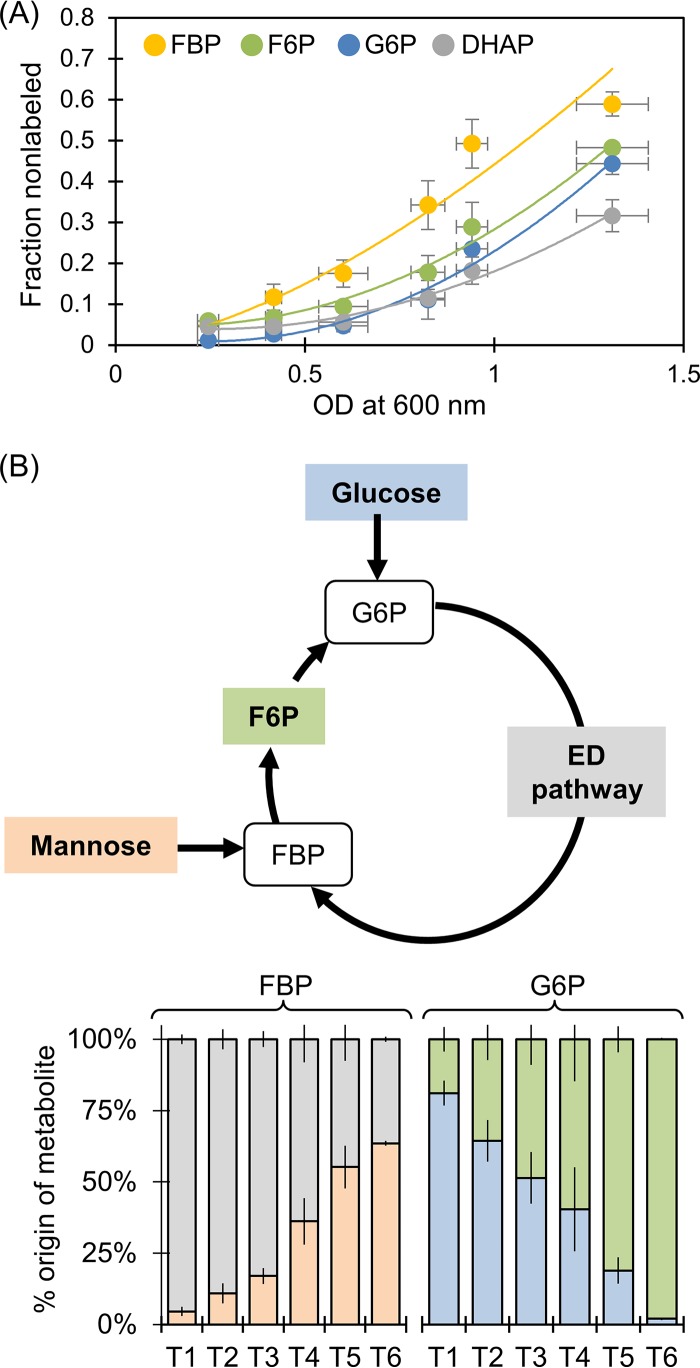
FIG 8.
Metabolic routing of mannose through central metabolism in the presence of glucose. (A) Kinetic profiling of metabolite labeling patterns in cells grown simultaneously on [U-13C6]glucose and unlabeled mannose; the lines through the data are to guide the eye. (B) Dynamic flux ratio analysis for the metabolic entry point of glucose versus mannose assimilation through G6P and FBP, respectively: flux from mannose (light orange), flux from ED pathway (gray), flux from F6P (green), flux from glucose (blue). Data in panel B were obtained at six time points during exponential growth: at OD600 of 0.21 to 0.27 (T1), at OD600 of 0.40 to.44 (T2), at OD600 of 0.54 to 0.67 (T3), at OD600 of 0.79 to.87 (T4), at OD600 of 0.90 to 0.98 (T5), and at OD600 of 1.2 to 1.4 (T6). In panels A and B, The data (average ± standard deviation) are from biological replicates (n = 3). The metabolite abbreviations are as listed in the legend for Fig. 1.

