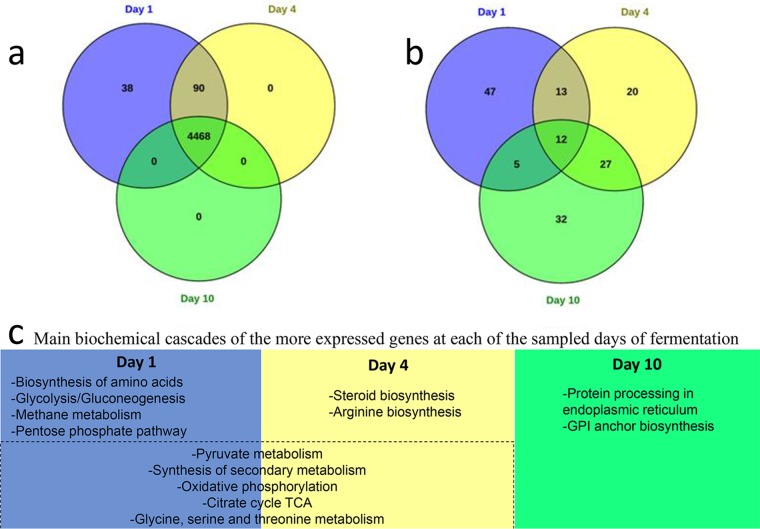
FIG 3.
Overview of transcriptomic analysis. (a) Venn diagram showing the differentially expressed genes shared between each fermentation point. (b) Venn diagram showing the genes shared between each fermentation point for the top 100 most highly expressed genes. (c) Main biochemical cascades of the most expressed genes at each sampled day of fermentation. GPI, glycosylphosphatidylinositol.

