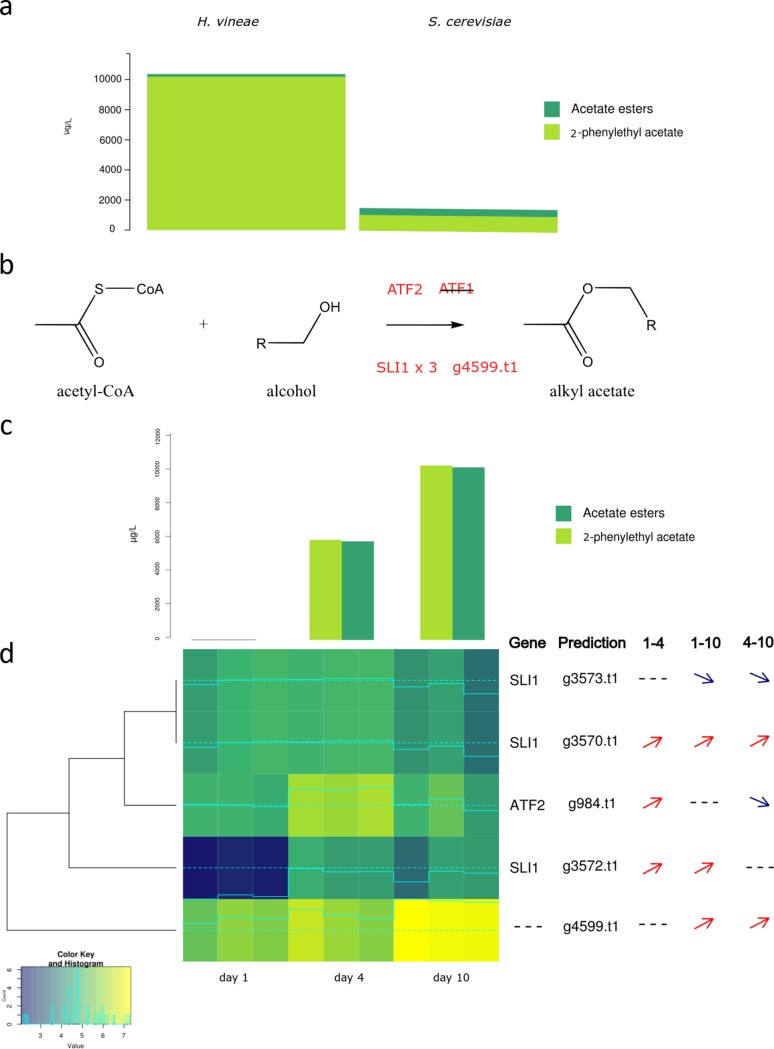
FIG 5.
Acetate ester production and putatively related genes. (a) Comparison of total acetate esters and 2-phenylethyl acetate produced in H. vineae and S. cerevisiae at day 10 of fermentation. (b) Metabolic pathway of acetate esters biosynthesis with putative enzymes involved in H. vineae. (c) Production of total acetate esters and 2-phenylethyl acetate by H. vineae at 1, 4, and 10 days of fermentation. (d) Expression heatmap of genes putatively involved in total acetate esters and 2-phenylethyl acetate production from H. vineae at 1, 4, and 10 days of fermentation. Lighter colors indicate higher expression values, and data are shown for triplicates. Significant changes in expression of each gene are indicated with arrows to the right of the heatmap as analyzed using the package edgeR (FDR < 0.05). 1–4, differential expression between days 1 and 4; 1–10, differential expression between days 1 and 10; 4–10, differential expression between days 4 and 10.

