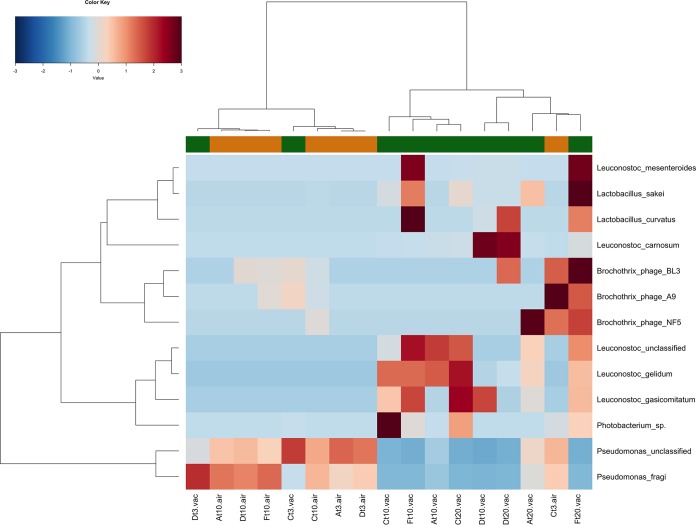
FIG 2.
Different taxonomic compositions in the microbiomes of beef stored aerobically and VP. Ward-linkage clustering based on the Spearman’s correlation coefficients of the proportion of the top 13 taxa identified in the beef samples. The color scale represents the scaled abundance of each variable, denoted as Z-score, with red indicating high abundance and blue indicating low abundance. Columns are colored according to the type of packaging: aerobic (orange) or under vacuum (green). In the sample labels, A, C, D, and F indicate meat chops from the four different retails; air, meat stored aerobically; vac, meat stored under vacuum.

