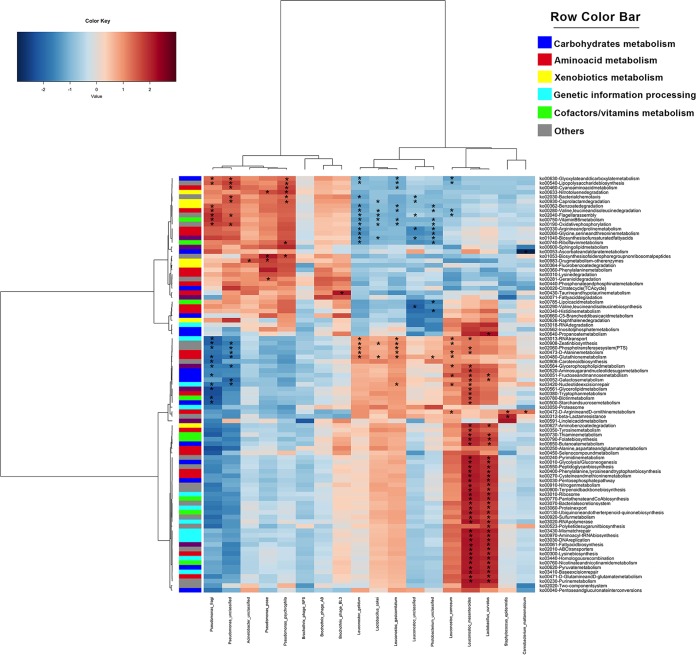
FIG 5.
Correlations between microbial taxa and KEGG pathways. Asterisks indicate significant correlations after correction for multiple comparisons (FDR < 0.05). Rows and columns are clustered by Euclidean distance and Ward-linkage hierarchical clustering. The intensity of the colors represents the degree of association as measured by Spearman’s correlations. Rows are colored according to the higher KEGG classification.

