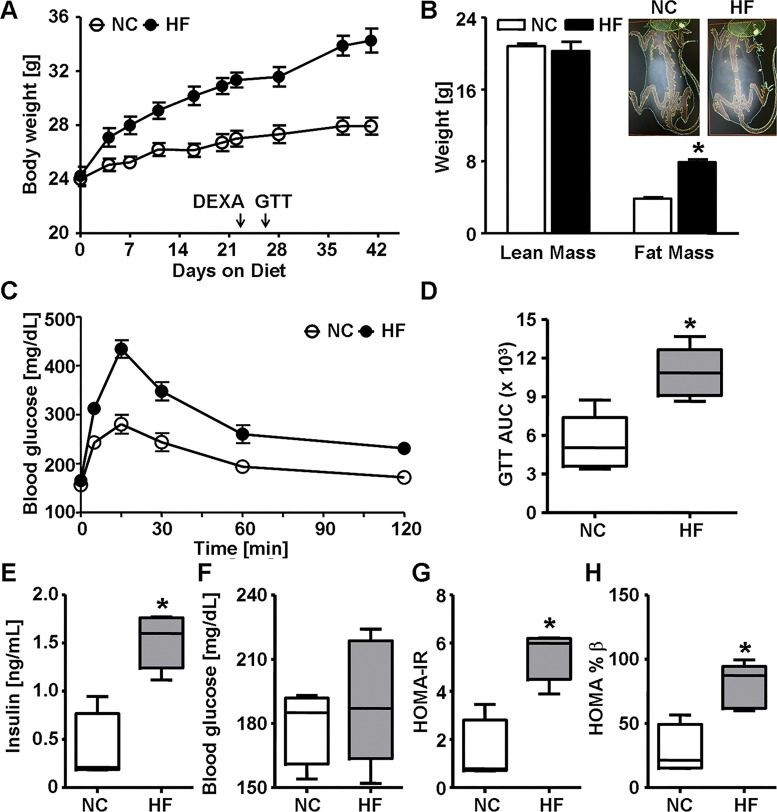
Fig. 1.
High fat diet-induced obesity and glucose intolerance in wild-type mice. A: body weight of male wild-type C57BL/6J mice fed normal chow (NC, 12.5% kcal fat) or high-fat diet (HF, 60% kcal fat) for 6 wk. Body weight was measured regularly, and arrows indicate when dual-energy X-ray absorptiometry (DEXA) scanning and glucose tolerance test (GTT) were performed. B: quantification of the DEXA scan analysis (and representative images, inset) of lean and fat mass in mice after 3 wk of diet. C and D: blood glucose levels during GTT (C) and calculated area under the curve (GTTAUC, D) in mice fed NC or HF for 3.5 wk. E–H: fasting (6-h) plasma insulin levels (E), blood glucose levels (F), homeostatic model assessment of insulin resistance (HOMA-IR) score (G), and homeostatic model assessment of β-cell function (HOMA-%β) score (H) in mice fed NC or HF for 6 wk. Values are means ± SE (n = 5, *P < 0.05, NC vs. HF).

