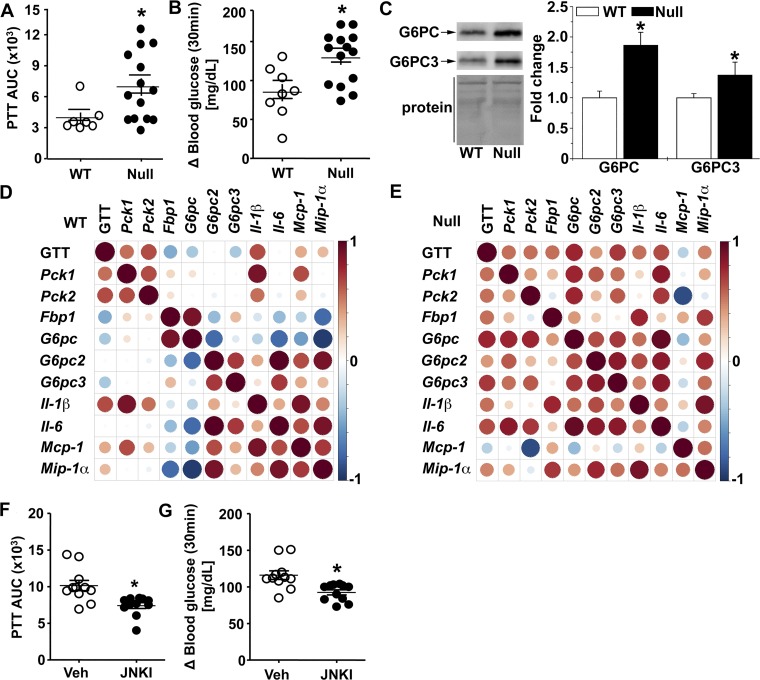
Fig. 9.
Glutathione S-transferase (GST) pi-isoform (GSTP) deficiency increases gluconeogenesis via JNK signaling. A and B: blood glucose levels after pyruvate tolerance test (PTT) measured as area under the curve (PTTAUC, A) and glucose appearance rate (delta 30-min blood glucose values relative to baseline, B) in wild-type (WT, n = 7) and GSTP-deficient (GSTP-null, n = 15) mice. C: representative Western blots of hepatic levels of gluconeogenic proteins, glucose-6-phosphatase catalytic subunit (G6PC) and G6PC3, in NC-fed WT and GSTP-null mice (n = 6 WT and GSTP-null mice for each blot). D and E: Spearman’s correlation coefficient analyses between hepatic mRNA levels of gluconeogenic and inflammatory markers in normal chow-fed WT and GSTP-null mice (n = 6–8). Color and size of spheres represent strength of correlation; that is, large, dark brown spheres represent perfect positive correlation (+1), and large, dark blue spheres represent perfect negative correlation (−1). Fbp, fructose-1,6-bisphosphatase; Mcp, monocyte chemoattractant protein; Mip, macrophage inflammatory protein; Pck, phosphoenolpyruvate carboxykinase. F and G: in GSTP-null mice treated with either vehicle (Veh, n = 11) or JNK inhibitor [JNKI, 1,9-pyrazoloanthrone (SP600125), 5 mg·day−1·kg body wt−1, 7 days, n = 11], blood glucose levels after PTT measured as area under the curve (F) and glucose appearance rate (delta 30-min blood glucose values relative to baseline, G). Values are means ± SE (*P < 0.05, WT vs. GSTP-null or Veh vs. JNKI).

