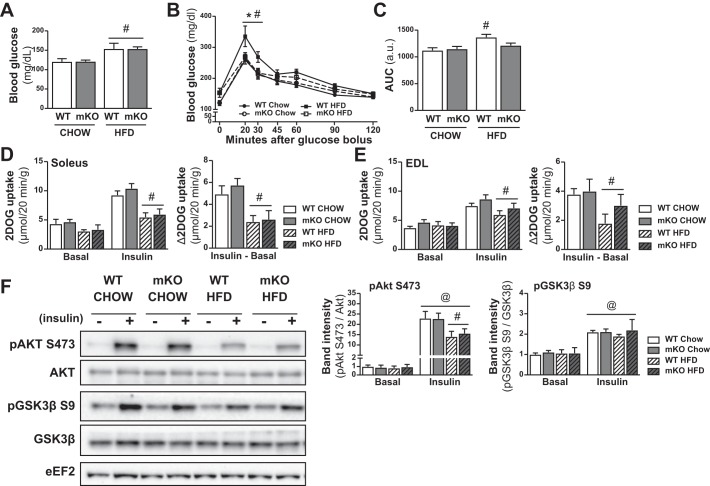
Fig. 3.
Unchanged insulin sensitivity in skeletal muscle of PDHmKO compared with WT mice. WT and PDHmKO mice were fed either a chow or a high-fat diet (HFD) for 12 wk. Blood glucose concentration in tail-vein blood sample of WT and PDHmKO mice after a 3-h fast (Chow, n = 8/8; HFD, n = 6/8) (A). Blood glucose concentration during an oral glucose tolerance test (OGTT) (B). Mice were gavaged with 2 g/kg body wt dextrose. Bar graph shows area under the curve for OGTT experiment (Chow, n = 8/8; HFD, n = 6/8) (C). 2-deoxyglucose (2DOG) uptake in soleus (D) or extensor digitorum longus (E) (EDL) muscles, in the basal state or in response to insulin stimulation. Insulin-stimulated 2-deoxy glucose uptake (2DOGU) was calculated as (2DOGUBASAL – 2DOGUINSULIN) (Chow, n = 8/8; HFD, n = 6/8). Representative blot of Akt and Akt phosphorylated on S473, as well as GSK3β and GSK3β phosphorylated on S9 (F). Bar graphs show quantification of phosphorylated Akt and GSK3β relative to total protein abundance of Akt and GSK3β (n = 4 basal and 4 insulin-stimulated per genotype and diet). All samples were derived at the same time and processed in parallel. Data reported as means ± SE two-way ANOVA, #P < 0.05, main effect of diet (A); 2-way ANOVA with repeated measures, Tukey’s post hoc test, *P < 0.05, HFD-fed PDHmKO compared with HFD-fed WT (B); #P < 0.05, HFD WT compared with chow-fed WT; 2-way ANOVA, Tukey’s post hoc test, #P < 0.05, HFD WT compared with chow WT (C); 2-way ANOVA, #P < 0.05, main effect of diet (D–E); three-way ANOVA, #P < 0.05, main effect of diet, @P < 0.05 main effect of insulin (F). PDHmKO, tamoxifen-inducible Pdha1 knockout mice; WT, wild-type.

