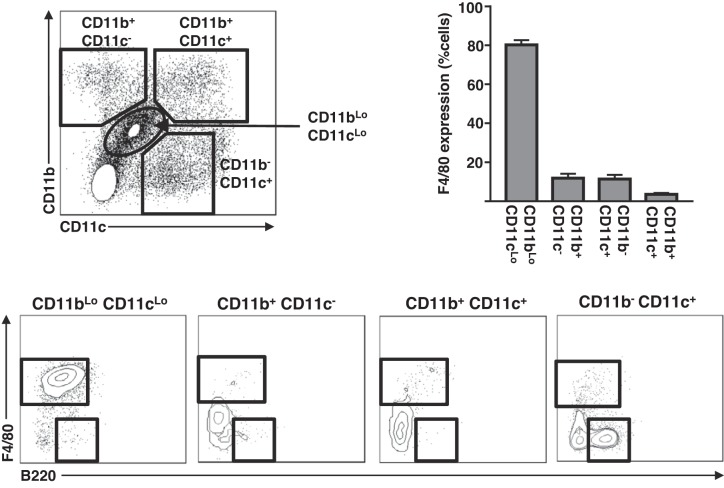
Fig. 1.
Myeloid populations in the liver. Livers from male mice were used to assess the shown myeloid cell populations by flow cytometry. Representative plots showing CD11b and CD11c expression of CD45+ mononuclear cells (top left), quantitated F4/80 expression of CD11bLo CD11cLo, CD11b+ CD11c−, CD11b+ CD11c+, and CD11b− CD11c+ populations (n = 7) (top right), and representative plots showing F4/80 and B220 expression of the indicated populations (bottom). All data are presented as means ± SE.

