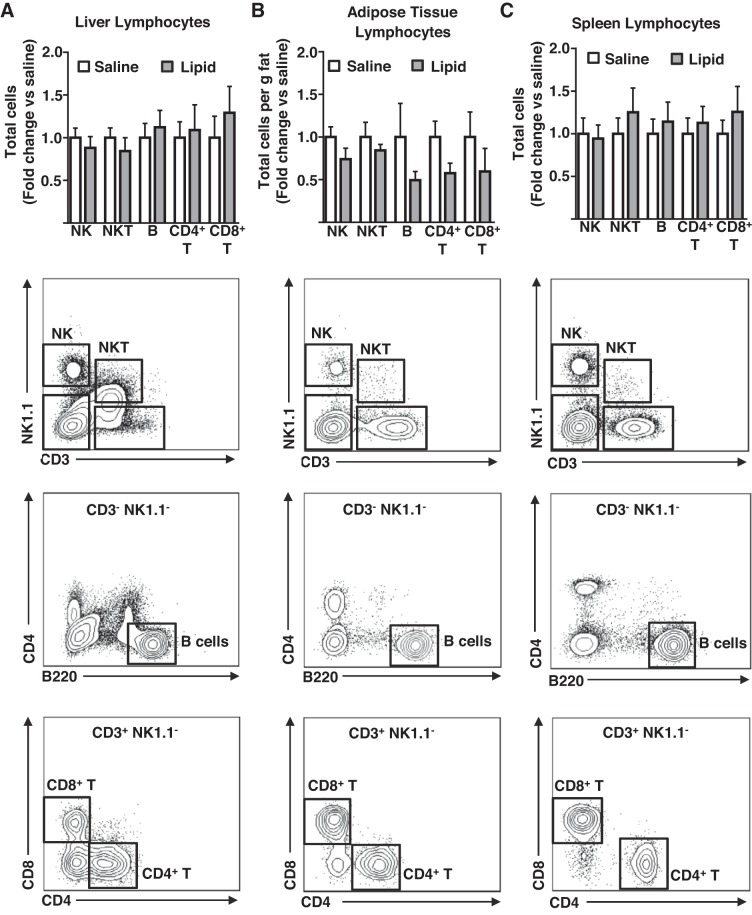
Fig. 3.
The effects of a lipid infusion on tissue lymphocyte content. Chronically catheterized male mice received an infusion of saline/heparin or lipid emulsion/heparin for 16 h before analyses. A: liver lymphocytes; B: adipose tissue lymphocytes; C: splenic lymphocytes as assessed by flow cytometry (n = 6–8). Representative flow plots for each tissue are shown below quantitation. All quantitative plots represent mean ± SE.

