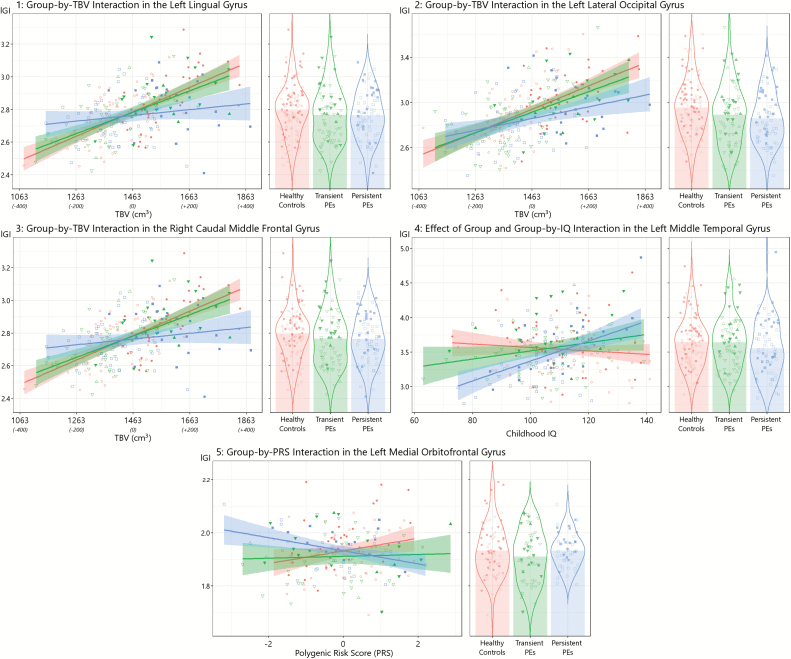
Fig. 2.
Differences in gyrification (lGI) between persistent psychotic experiences (PEs) (squares), transient PEs (triangles), and (circles). Females are shown as open symbols and males are filled symbols. Emergent and resolving PEs are denoted as upward-facing and downward-facing triangles, respectively. Panels 1–3 visualize differences in the scaling of the cluster average lGI with total brain volume (group-by-TBV interaction) and the x-axis in the scatterplot denotes the actual TBV with mean centred scores in parentheses. Panel 4 depicts the differences in slope of lGI with increasing intelligence quotient (group-by-IQ interaction) in the scatterplot and gives the main effect of group in the violin plot. Panel 5 highlights the different slope for lGI in persistent PEs with increasing polygenic risk score (group-by-PRS interaction).

