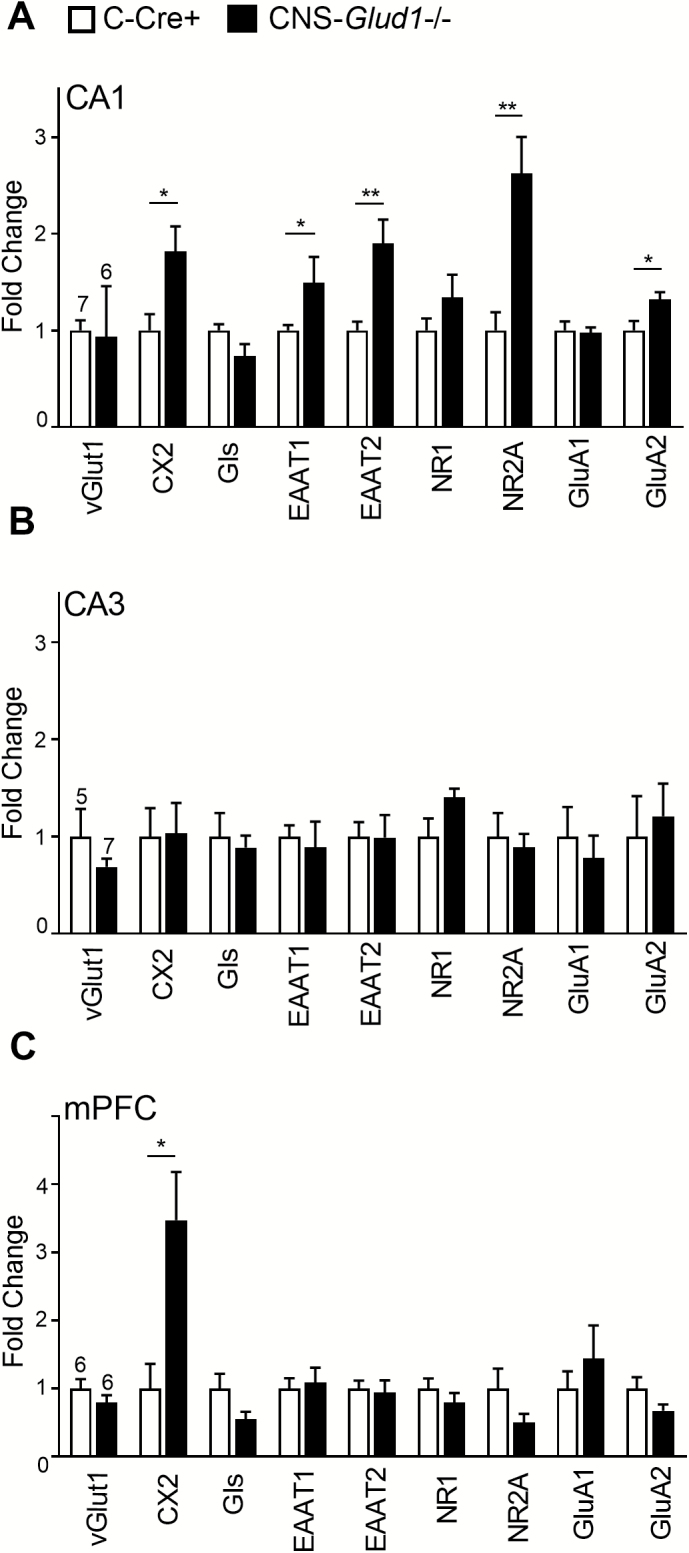
Fig. 3.
CNS-Glud1−/− mice show increased expression of excitatory markers in CA1. (A) In the right CA1, CNS-Glud1−/− mice show increased expression of excitatory markers Cx2 (F[1,11] = 7.136; P < .05), NR2A (F[1,11] = 9.568; P < .05), GluA2 [F[1,11] = 5.342; P < .05), EAAT1 (F[1,11] = 5.049; P < .05), and EAAT2 (F[1,11] = 17.082; P < .01); n’s: C-Cre+ 7 (CNS-Glud1−/− 6). (B) In CA3, no genotypic differences were found (n’s: C-Cre+ 7, CNS-Glud1−/− 6). (C) In mPFC, CNS-Glud1−/− mice showed increased expression of Cx2 (F[1,10] = 9.078; P < .05, n’s: C-Cre+ 6, CNS-Glud1−/− 6). Data are presented as mean fold change ± SEM. *P < .05, **P < .01.

