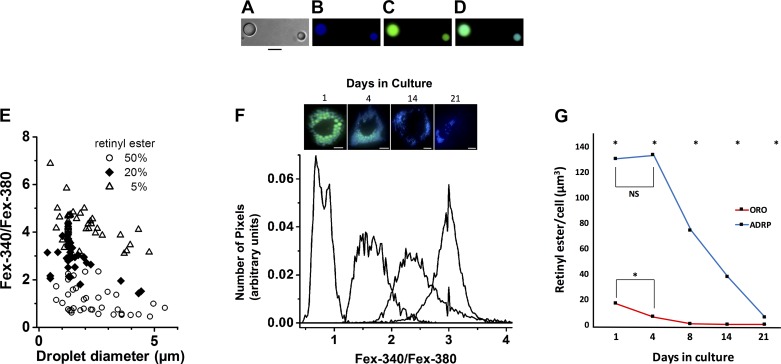
Fig. 5.
Hepatic stellate cell (HSC) lipid droplet (LD) retinyl ester (RE) concentration does not decrease until after cells have undergone culture-induced activation. A–D: synthetic LDs containing 50% triglyceride and 50% retinyl palmitate were created (A), and photomicrographs were taken with phase light at 340 nm (B) and light at 380 nm (C). A 340 and 380 nm merged image is also shown (D). Scale bars = 5 μm. E: ratios of excitation as measured at 340:380 nm vs. droplet size for synthetic droplets containing different RE concentrations were graphed. F: photomicrographs of in vitro HSC LDs were taken at days 1, 4, 14, and 21 in culture with light at 340 nm and 380 nm, and representative histograms were plotted showing peak 340:380 nm ratios for LDs at each time point. Panel at the top of the image depicts representative live HSCs at the designated days (merged 340 and 380 nm images are shown). Scale bars = 10 μm. G: total cellular RE content was determined by multiplying cellular LD volume [LD number per cell * (4/3 π r3)] where r = LD radius using oil red o (ORO) vs. adipocyte differentiation-related protein (ADRP) labeling (Fig. 1, B and C) by the RE percentage extrapolated from Fig. 5, E and F. A minimum of 10 cells per time point was analyzed. n = 3 independent rat HSC isolations. *P < 0.05. NS, not significant.

