Fig. 6.
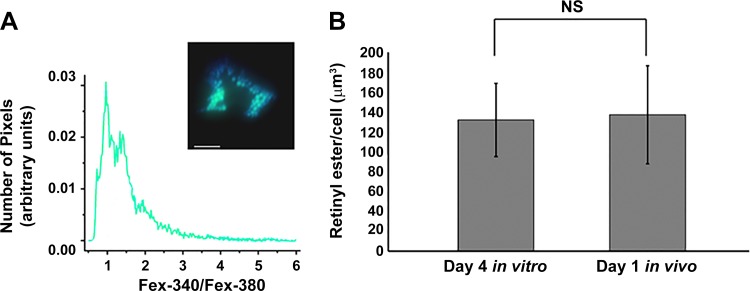
In vivo and in vitro activated hepatic stellate cells (HSCs) exhibit similar retinyl ester (RE) content. A: photomicrographs of in vivo activated HSC lipid droplets (LDs) were taken 12 h after HSC isolation with light at 340 nm and 380 nm, and the histogram shows peak 340:380 nm ratios for the LDs. Inset: a representative live HSC (merged 340 and 380 nm image). Scale bar = 10 μm. B: total cellular RE content for day 4 in vitro and day 1 in vivo activated HSC LDs was determined by multiplying cellular LD volume [LD number per cell * (4/3 π r3)] where r = LD radius using adipocyte differentiation-related protein labeling (as in Fig. 1, B and C and Fig. 4, respectively) by the RE percentage extrapolated from peak 340:380 ratios (histograms Figs. 5F and 6A, respectively) and data from synthetic LDs (Fig. 5E). A minimum of 10 cells per time point were analyzed. n = 3 independent rat HSC isolations. NS, not significant.

