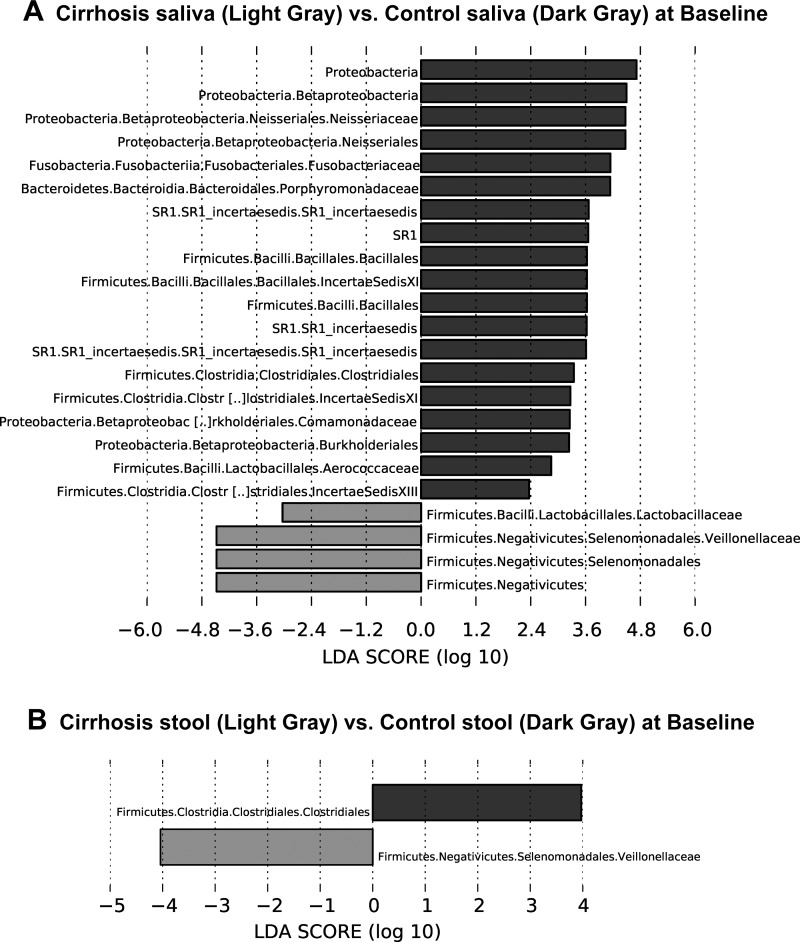
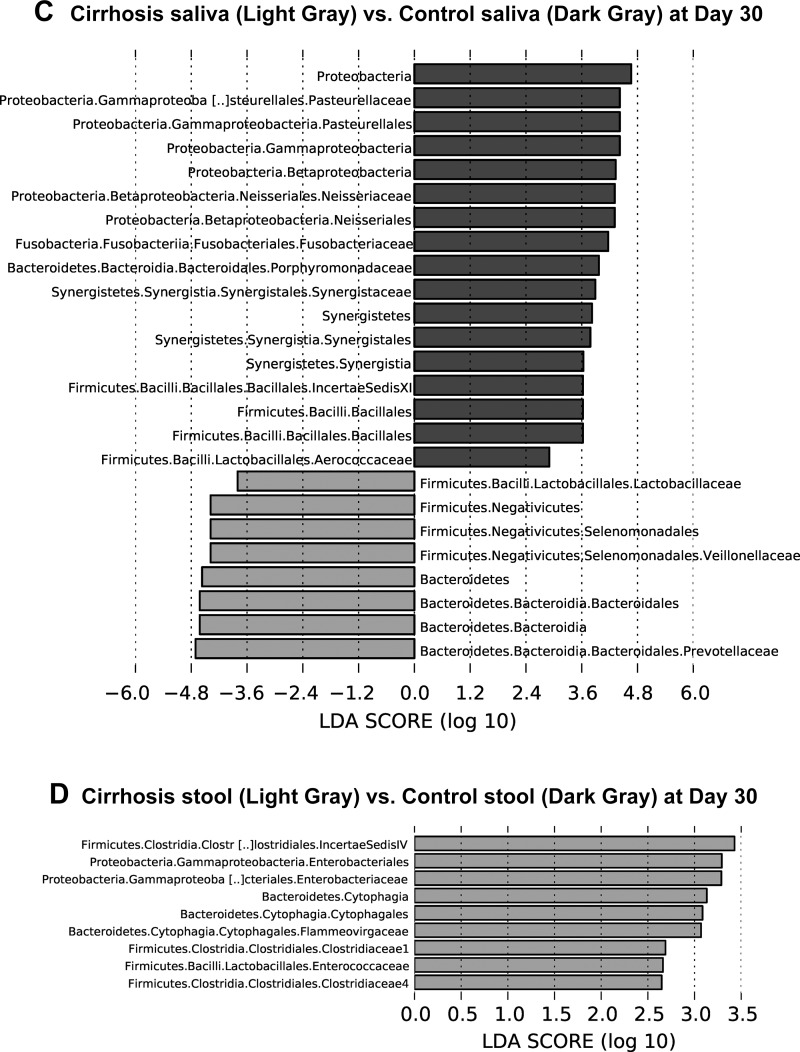
Fig. 4.
Linear discriminant function effect size (LEfSe) comparisons of microbiota family-level changes between groups and tissues. The x-axis is the log change in linear discriminant function between the groups displayed. A: changes between Cirrhosis saliva (light gray) and Control saliva (dark gray) at baseline. B: changes between Cirrhosis stool (light gray) and Control stool (dark gray) at baseline. C: changes between Cirrhosis saliva (light gray) vs. Control saliva (dark gray) at day 30. D: changes between Cirrhosis stool vs. Control stool (light gray) at day 30 only showed a decrease in taxa shown in cirrhosis and an increase in controls.


