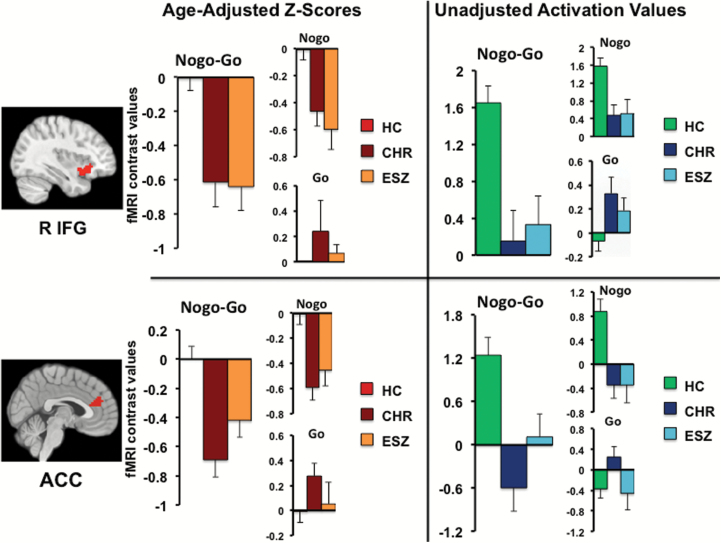
Fig. 1.
Bar graphs display age-adjusted z-score (left) and age un-adjusted (right) cluster mean (±standard error of the mean) by group for regions showing a significant main effect of group (P < .005 height threshold; P < .05 FWE cluster-corrected). Contrast values are displayed for NoGo–Go, whereas individual conditions (NoGo, Go) represent contrasts with the implicit baseline. Both CHR and ESZ groups showed significantly reduced NoGo–Go response relative to the HC group in right inferior frontal gyrus (RIFG) and anterior cingulate cortex (ACC) regions.

