
Figure 3.
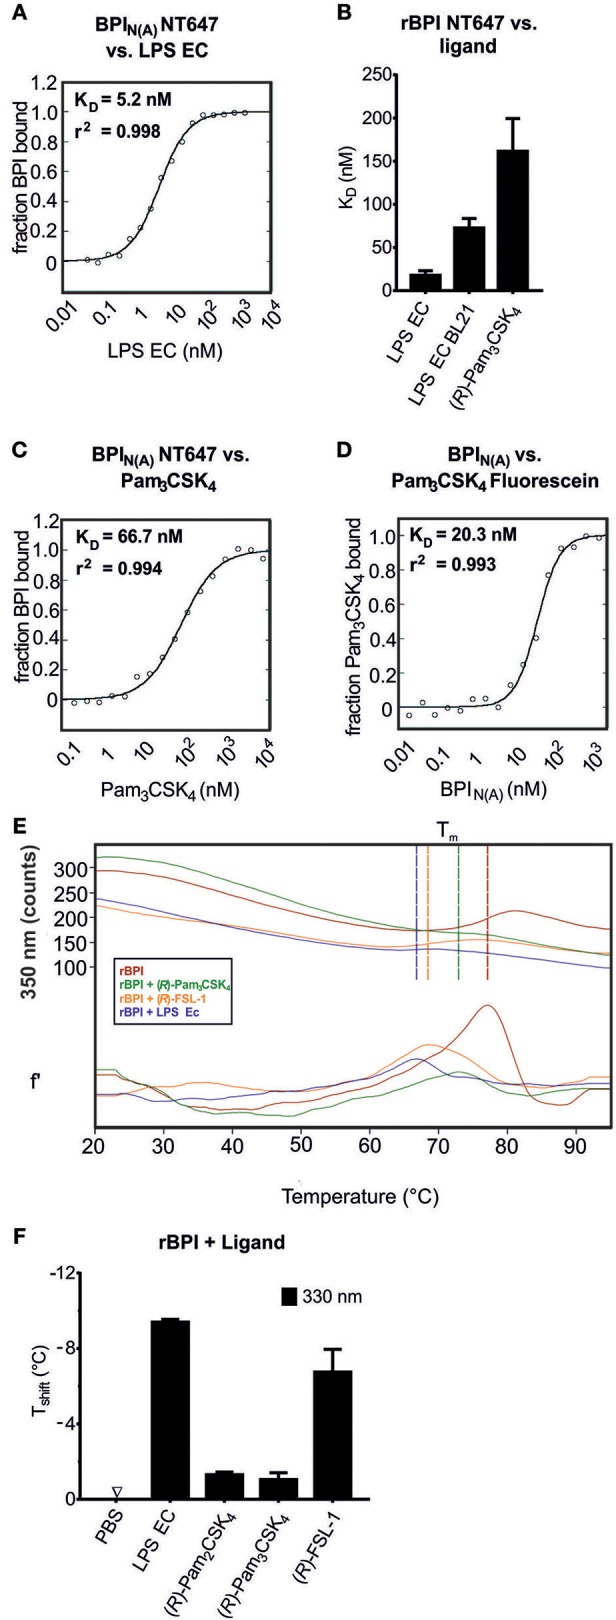
Determination of the affinity of BPI to bLPs. MST binding assay (A–D). Changes in movement in MST were monitored using BPIN(A) NT647 incubated with increasing concentrations of the ligands [LPS EC (A), Pam3CSK4 (C)] or Pam3CSK4 Fluorescein incubated with increasing concentrations of BPIN(A) (D). The binding affinity and r2 values are indicated. The same assay using NT647-labeled rBPI was used to calculate KD values for the interactions of the protein to LPS EC, LPS EC BL21, and (R)-Pam3CSK4 (B). NanoDSF was performed for rBPI incubated with the indicated ligands (E,F). Temperature-dependent change in fluorescence is indicated for the wavelength of 350 nm [E, upper part: absolute values, lower part: first derivate (f')]. Vertical lines indicate Tm. The shift in melting temperature (Tshift) caused by the ligands is shown (F). Temperature shifts above 1°C are interpreted as the influence of an interaction on the thermal stability of the protein. Data represent the mean of two (A,C,D) or three (B) technical replicates or means ± SD of two biological replicates (E,F).