-
A, B
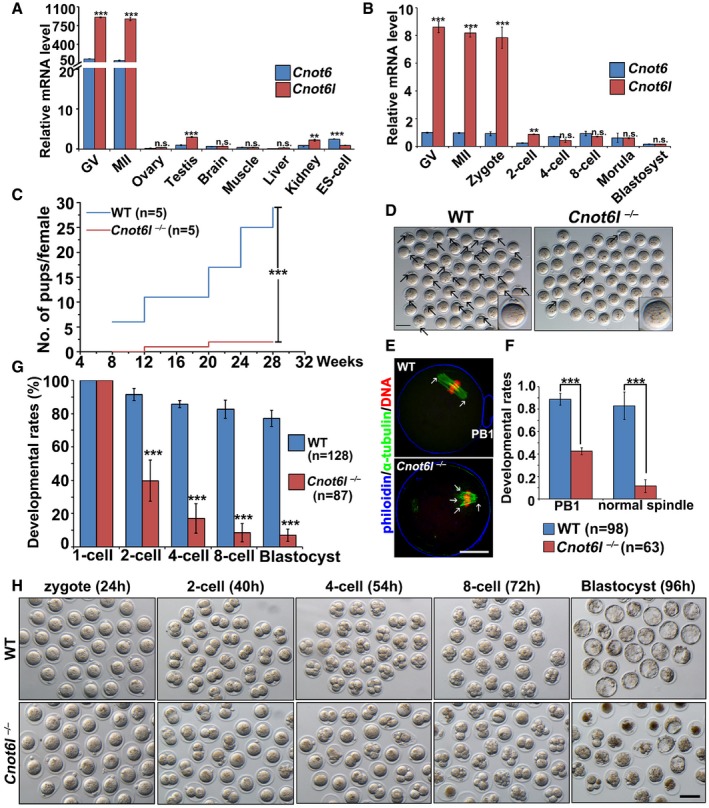
Quantitative RT–PCR results showing relative expression levels of mouse Cnot6 and Cnot6l in oocytes (GV and MII), somatic tissues, ES cells (A), and preimplantation embryos (B). n = 3 biological replicates.
-
C
Cumulative numbers of pups per female showing fertility of WT and Cnot6l
−/− female mice. n = 5 females for each genotype.
-
D
Representative image results of oocytes collected from oviducts of WT and Cnot6l
−/− mice at 16 h after hCG injection. Scale bar, 100 μm. Arrows indicate polar body‐1 (PB1).
-
E
Confocal microscopy results of oocytes collected from oviducts of WT and Cnot6l
−/− mice at 16 h after hCG injection. Scale bar, 20 μm. Arrows indicate spindle poles.
-
F
Rates of PB1 emission and normal spindle formation in oocytes ovulated by WT and Cnot6l
−/− female mice. The numbers of analyzed oocytes are indicated (n).
-
G
Quantification of preimplantation embryos derived from WT and Cnot6l
−/− females that develop to the indicated stages after hCG administration and mated with adult WT males. The numbers of analyzed embryos are indicated (n).
-
H
Representative images of embryos collected from the oviducts or uteri of WT and Cnot6l
−/− female at indicated time points after hCG administration. Scale bar, 100 μm.
Data information: Error bars, SEM. **
‐test. n.s.: non‐significant.

