-
A
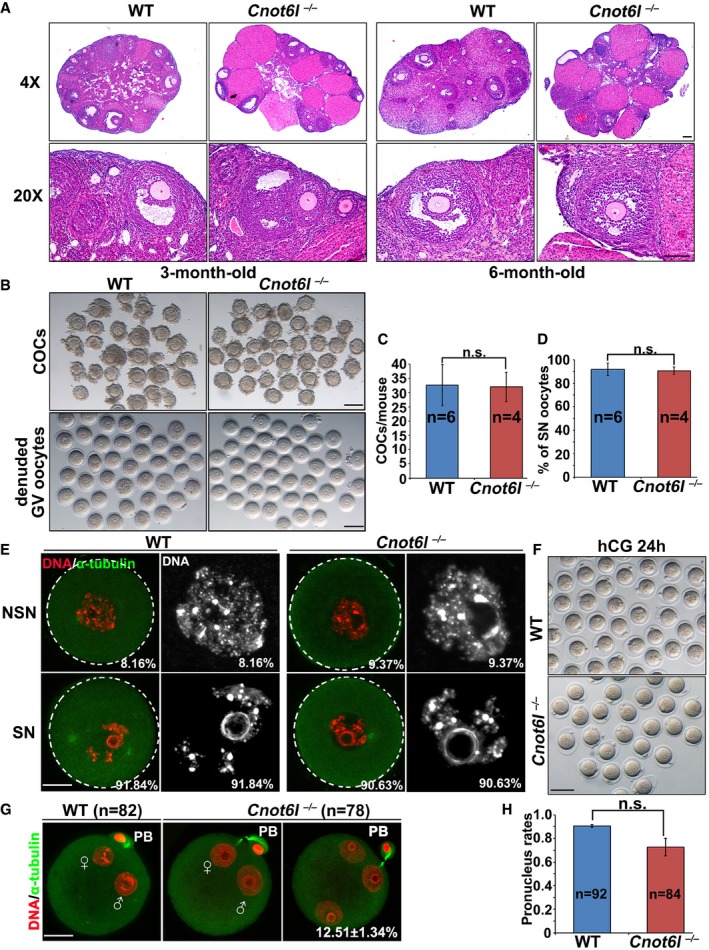
Hematoxylin and eosin staining showing ovarian histology of WT and Cnot6l
−/− mice. Scale bar, 100 μm.
-
B, C
Representative images (B) and numbers (C) of cumulus–oocyte complexes (COCs) and denuded oocytes collected from antral follicles of WT and Cnot6l
−/− mice. Scale bar, 100 μm. Error bars, SEM. n.s.: non‐significant. The numbers of analyzed mice are indicated (n).
-
D
Percentage (%) of oocytes containing a surrounded nucleolus (SN) among oocytes in (B). Error bars, SEM. n.s.: non‐significant. The numbers of analyzed mice are indicated (n).
-
E
Confocal microscopy results showing representative oocytes containing a non‐surrounded nucleolus (NSN) or a surrounded nucleolus (SN) among oocytes in (B). Percentages of NSN and SN oocytes among the total oocytes being collected are indicated in the corner. Scale bar, 20 μm.
-
F
Representative images of zygotes collected from oviducts of WT and Cnot6l
−/− female mice at 24 h after hCG injection and were mated with WT male mice. Scale bar, 100 μm.
-
G
Confocal microscopy results showing representative zygotes containing 2 or 3 pronuclei. Scale bar, 20 μm.
-
H
Quantification of pronucleus formation rates in zygotes shown in (F). Error bars, SEM. n.s.: non‐significant. The numbers of analyzed zygotes are indicated (n).

