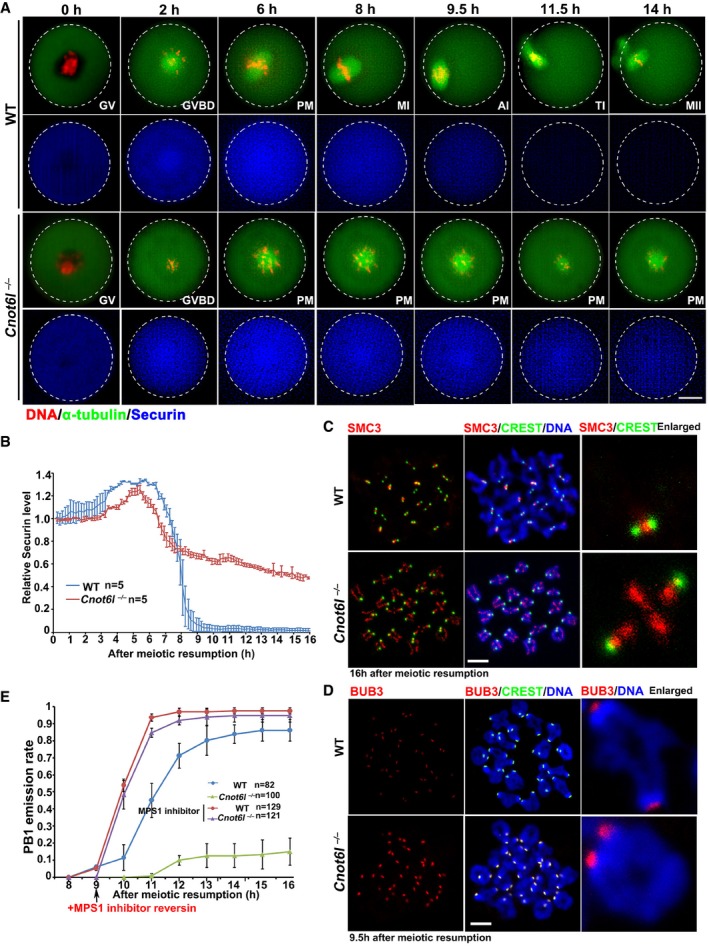
Live‐cell imaging results showing in vitro meiotic division of WT and Cnot6l
−/− oocytes. Abbreviations: PM, prometaphase; MI, metaphase I; AI, anaphase I; TI, anaphase I‐metaphase II transition; MII, metaphase II; PB1: polar body‐1. Hours after released from GV arrest are indicated. Scale bar, 20 μm.
Data represent the mean and standard deviations of mCherry‐securin fluorescence intensity in WT and Cnot6l
−/− oocytes at each time point. Values from individual oocytes are normalized relative to that at 0 h after released from GV arrest. The numbers of analyzed oocytes are indicated (n).
SMC3 immunofluorescence showing cohesin on chromosomes of WT and Cnot6l
−/− oocytes at 16 h after culture. Centromeres and DNA were labeled by CREST and DAPI, respectively. Scale bar, 5 μm.
BUB3 immunofluorescence on chromosome spreads made from WT and Cnot6l
−/− oocytes at 9.5 h after culture. More than 8 oocytes were observed for each genotype with similar results. Scale bar, 5 μm.
PB1 emission rates in WT and Cnot6l
−/− oocytes cultured with or without MPS1 inhibitor reversin (5 μm). Reversin is added at 9 h after culture. Error bars, SEM. The numbers of analyzed oocytes are indicated (n).

