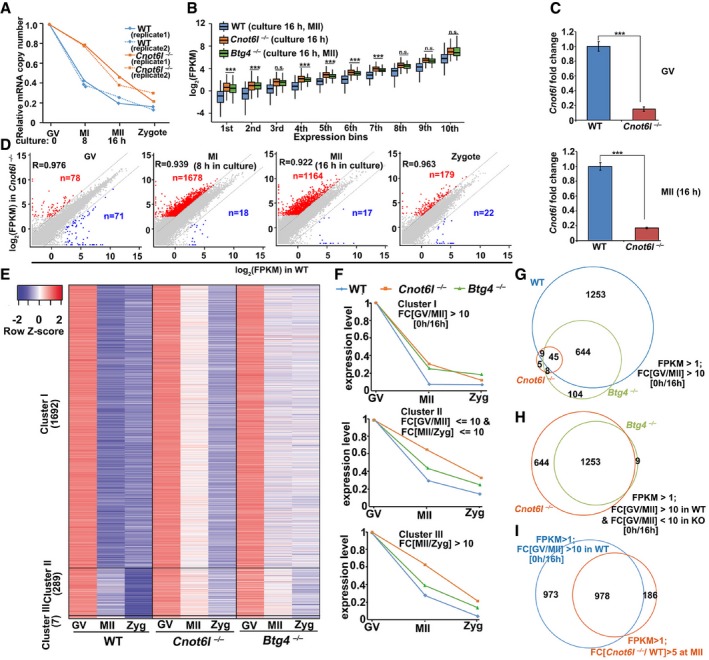
Relative mRNA copy number dynamics in WT and Cnot6l
−/− samples at the indicated stages. Error bars indicate values of the two biological replicates.
Box plot showing gene expression levels of WT, Cnot6l
−/−, and Btg4
−/− oocytes at the MII stage. Genes were divided into 10 bins according to their expression levels in the WT MII oocytes. The box indicates upper and lower quantiles, the thick line in the box indicates the median, and the whiskers represent 2.5th and 97.5th percentiles. ***P < 0.001 by two‐tailed Student's t‐test. n.s.: non‐significant.
qRT–PCR results showing the relative expression levels of Cnot6l in oocytes collected from WT and Cnot6l
−/− mice (Cnot6l
−/−/WT). Error bars, SEM. ***P < 0.001 by two‐tailed Student's t‐test. n = 3 biological replicates.
Scatter plot comparing transcripts between WT and Cnot6l
−/− oocytes (at GV, MI, and MII stages) and zygotes derived from these oocytes. Transcripts decreased or increased more than 5‐fold in Cnot6l
−/− oocyte samples were highlighted with blue or red, respectively.
Heatmap showing transcripts that were degraded during meiotic maturation (GV/Zygote > 10) in WT oocytes. The definition of cluster I‐III is described in the text.
Relative mRNA copy number dynamics of the three gene clusters in WT, Cnot6l
−/−, and Btg4
−/− samples.
Venn diagrams showing the overlap of transcripts that were significantly degraded during GV‐to‐MII transition in WT, Cnot6l
−/−, and Btg4
−/− oocytes (GV/MII > 10).
Venn diagrams showing the overlap of transcripts that were stabilized during GV‐to‐MII transition in Cnot6l
−/− and Btg4
−/− oocytes (GV/MII > 10 in WT, but < 10 in KO).
Venn diagrams showing the overlap of transcripts that were destabilized in GV–MII transition (FPKM > 1; fold change (GV/MII) > 10) of WT oocytes and the genes upregulated in this process after Cnot6l knockout (FPKM > 1; fold change (Cnot6l
−/−/WT at MII) > 10).

