-
A
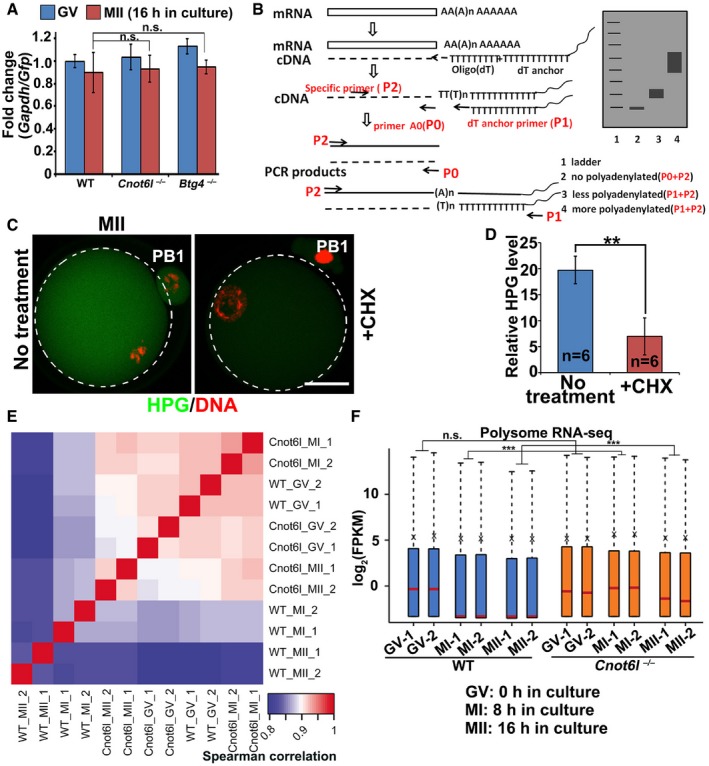
Quantitative RT–PCR (qRT–PCR) showing the relative levels between Gapdh and Gfp in GV and MII oocytes collected from WT, Cnot6l
−/−, and Btg4
−/− mice. mRNAs encoding GFP were in vitro transcribed and equally added to each sample (0.1 ng/μl) before RNA extraction. Error bars, SEM. n.s.: non‐significant. n = 3 technical replicates.
-
B
Strategy of the mRNA poly(A) tail assay. P0, primer A0 that located at the end of mRNA 3′TUR without poly (A); P1, dT anchor primer (GCGAGCTCCGCGGCCGCGT12); P2, gene‐specific primer.
-
C, D
Immunofluorescence (C) and quantification (D) of HPG showing the overall translation levels of MII oocytes cultured in medium with or without cycloheximide (CHX, 20 μM). Scale bar, 20 μm. **P < 0.01 by two‐tailed Student's t‐test. n = 3 biological replicates.
-
E
Heatmap of Spearman correlation coefficients of transcripts associated with polysomes in WT and Cnot6l
−/− oocytes at GV, MI, and MII stages.
-
F
Levels of polysome‐bound transcripts in WT and Cnot6l
−/− oocytes at indicated stages (two biological repeats). The expression level of each transcript was normalized by the mCherry spike‐in, which was in vitro transcribed and equally added to each sample before RNA extraction. The box indicates upper and lower quantiles, the red line in the box indicates the median, and the whiskers represent 2.5th and 97.5th percentiles, respectively. ***P < 0.001 by two‐tailed Student's t‐test. n.s.: non‐significant.

