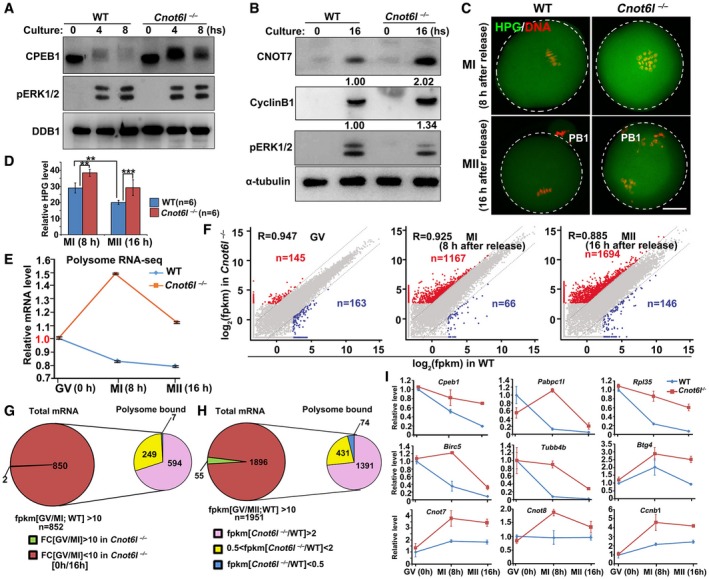
Figure 6. Meiotic resumption‐triggered deadenylation of maternal transcripts was blocked in Cnot6l −/− oocytes.

-
A, BWestern blot results showing the levels of CPEB1 in WT and Cnot6l −/− oocytes at the indicated time points after meiotic resumption. Total proteins from 50 (A) or 100 (B) oocytes are loaded in each lane. DDB1 (A) or α‐tubulin (B) is blotted as a loading control. Experiments were performed three times with reproducible results; a representative result is shown.
-
C, DImmunofluorescence (C) and quantification (D) of L‐homopropargylglycine (HPG) showing the overall translation levels of MI and MII oocytes collected from WT and Cnot6l −/− mice. Scale bar, 20 μm. Error bars, standard deviations (n = 6 oocytes for each genotype). **P < 0.01, ***P < 0.001.
-
ERelative mRNA copy numbers of polysome‐bound transcripts in WT and Cnot6l −/− oocytes at indicated stages. Error bars indicate values of the replicates.
-
FScatter plot comparing polysome‐bound transcripts between WT and Cnot6l −/− oocytes at GV, MI, and MII stages, respectively. Transcripts decreased or increased more than 5‐fold in Cnot6l −/− oocyte samples were highlighted with blue or red, respectively.
-
GPie chart in left depicts total transcripts significantly degraded during GV‐MI transitions in WT oocytes. Pie chart in right shows the polysome association of transcripts that were deemed to be degraded during GV‐MI transitions in WT oocytes, but were stabilized after Cnot6l knockout.
-
HPie chart in left depicts total transcripts significantly degraded during GV–MII transitions in WT oocytes. Pie chart in right shows the polysome association of transcripts that were deemed to be degraded during GV–MII transitions in WT oocytes, but were stabilized after Cnot6l knockout.
-
IQuantitative RT–PCR results showing the relative levels of indicated transcripts in association with polysomes in WT and Cnot6l −/− oocytes at GV, MI, and MII stages. Error bars, standard deviations (n = 3 biological repeats).
Source data are available online for this figure.
