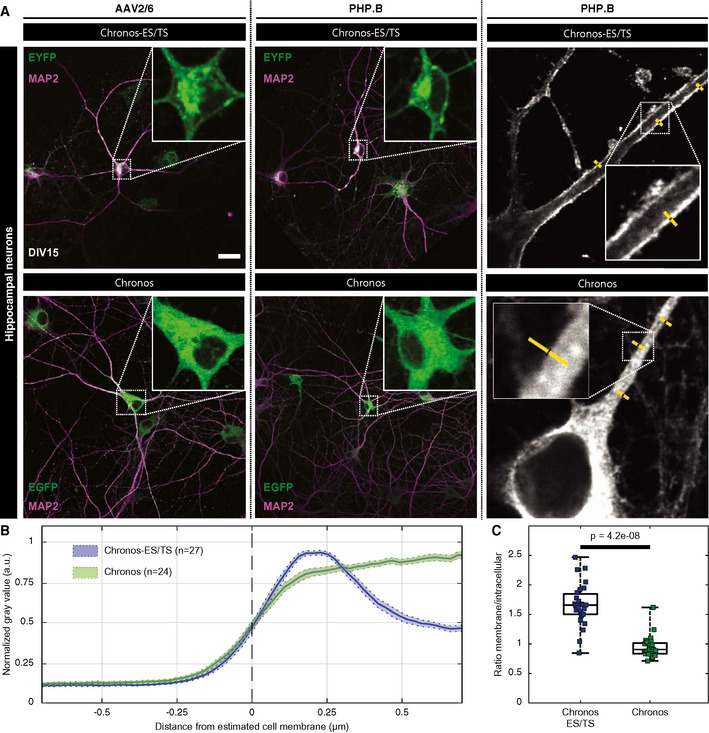
Figure 3. Improved membrane expression of optimized Chronos‐ES/TS in hippocampal neurons.

- Hippocampal neurons infected at DIV 10 with two different versions of Chronos show very distinct expression patterns. Neurons infected with Chronos‐ES/TS (upper panels) either using AAV2/6 (left) or PHP.B virus (middle) show very specific plasma membrane expression in somatic regions and proximal dendrites. Infection of neurons with Chronos (lower panels) either using AAV2/6 (left) or AAV‐PHP.B (middle) showed more intracellular opsin abundance. Right panels show exemplary line profile placement (yellow). Scale bar: 50 μm applies to all panels.
- Peak‐normalized line profiles (1.5 μm) centered on the outer cell edge of AAV‐PHP.B transduced hippocampal proximal dendrites expressing Chronos‐ES/TS (blue) or Chronos (green) as in (A): mean ± SEM. Chronos‐ES/TS‐expressing cells showed a clear peripheral, likely plasmalemmal peak, which is missing in Chronos‐expressing cells.
- Box and whisker plot of the ratio of maximal membrane and maximal intracellular fluorescence of immunolabeled hippocampal neurons expressing Chronos‐ES/TS or Chronos: Mann–Whitney U‐test showed significantly higher ratio in Chronos‐ES/TS cells demonstrating an improved membrane expression of Chronos‐ES/TS (P‐value = 4.2e‐8). The horizontal line within the box indicates the median, boundaries of the box indicate the 0.25‐ and 0.75‐percentile, and the whiskers indicate the highest and lowest values of the results. Squares: individual data points. For details on membranous and cytoplasmic area, see Materials and Methods section.
