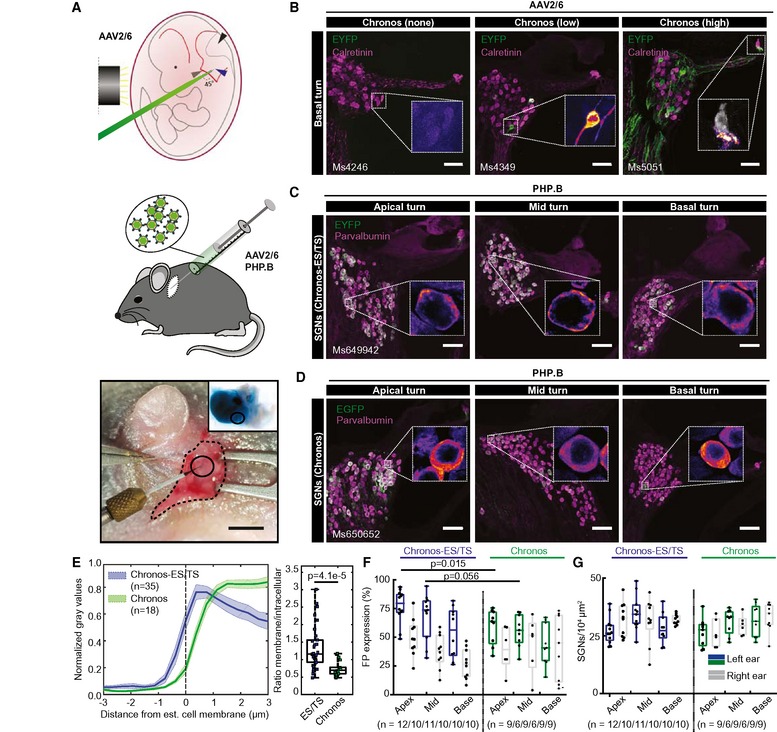
Upper panel: schematic representation of the viral injection into the embryonic otocyst (left: black cylinder marks the light guide used to trans‐illuminate the embryo in the uterus after mobilization from the abdominal cavity, green: micropipette filled with fast green‐colored AAV suspension). Middle panel: schematic representation of AAV injection into the postnatal cochlea via the round window (RW). Lower panel: surgical situs of a p7 mouse with retroauricular incision, graphical aid encircles the injection site). Inset shows ex vivo cochlea just after AAV injection via RW. Scale bar: 2 mm.
Maximum projection of confocal images of immunolabeled mid‐modiolar cochlear cryosections (exemplary sections of basal turn) of embryonically AAV2/6‐Chronos‐injected mice collected at 4 weeks of age. EYFP (green) marks transduced SGNs, calretinin (magenta) was used as generic marker of SGNs, scale bar: 50 μm. In the inset, color code for EYFP channel was changed to fire (EYFP). Left panel: most common, non‐expressing example, inset shows zoom of negative SGNs. Middle panel: occasional, sparsely expressing example, inset: one out of two positive SGNs. Right panel: rare, highly expressing example, inset: negative inner hair cell (calretinin in gray), exclusive localization of EYFP in the SGN boutons and fibers.
Postnatally AAV‐PHP.B‐Chronos‐ES/TS‐injected mouse (see (B) except where stated differently). EYFP (green) marks transduced SGNs, parvalbumin (magenta) was used as generic marker of SGNs, scale bar: 50 μm. High transduction rate, good membrane expression. In inset, color code for the green channel was changed to fire for better visualization. Similar to (B).
Postnatally AAV‐PHP.B‐Chronos‐injected mouse (see (C) except where stated differently). Substantial SGN transduction, poor membrane expression.
Line profile analysis of FP immunofluorescence across the membrane of SGN somata. Traces were centered at the transition from high to low parvalbumin immunofluorescence as a proxy of plasma membrane location. Left panel: clear membrane abundance in Chronos‐ES/TS (blue, mean ± SEM), but mostly intracellular localization in Chronos (green, mean ± SEM). Right panel: Box and whisker plot of the ratio of maximal membrane and maximal intracellular FP fluorescence for Chronos‐ES/TS (left) and Chronos (right): stronger relative membrane expression in Chronos‐ES/TS (Mann–Whitney
U‐test,
P‐value = 4.1e‐5). Squares: individual data points. For details on membranous and cytoplasmic area, see
Materials and Methods section.
Box and whisker plot of the fraction of FP‐positive SGNs (transduced out of all parvalbumin‐positive SGNs) for the apical, middle, and basal cochlear turn of the injected ear (colored) and contralateral, non‐injected (gray) ear of Chronos‐ES/TS‐AAV‐PHP.B and Chronos‐AAV‐PHP.B mice. Points: individual animals plotted on top; n refers to number of cochleae studied. The horizontal line within the box indicates the median, boundaries of the box indicate the 0.25‐ and 0.75‐percentile, and the whiskers indicate the highest and lowest values of the results.
Box and whisker of the SGN density for the apical, middle, and basal cochlear turn of the injected (colored) ear and the contralateral, non‐injected (gray) ear (as in (F)). No significant differences between Chronos and Chronos‐ES/TS or between injected and non‐injected ear. Points: individual animals plotted on top; n refers to number of cochleae studied.

