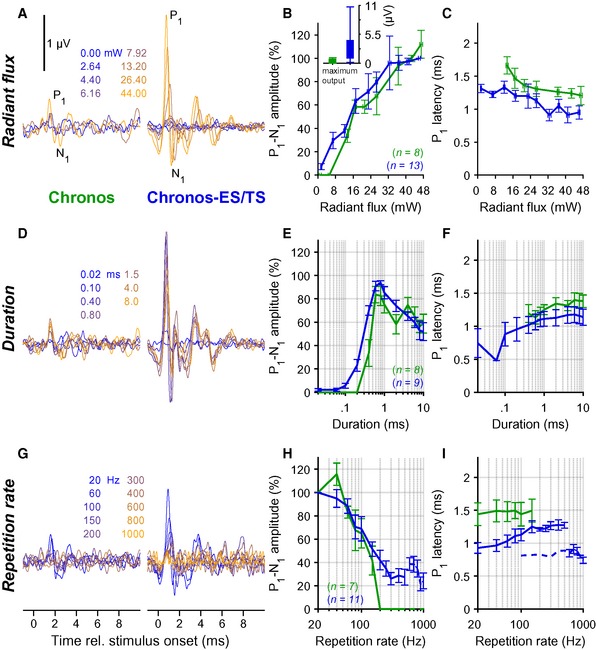
oABRs driven with varying radiant flux (1 ms at 10 Hz, colors code the radiant flux in mW) for exemplary mice injected with AAV‐PHP.B‐Chronos (left) or AAV‐PHP.B‐Chronos‐ES/TS (right).
Normalized P1–N1 amplitude of oABR as a function of light intensity for Chronos as in (A) (green, throughout figure) and Chronos‐ES/TS (blue). Radiant flux was binned per 5 mW steps (horizontal error: ± SEM). Inset: maximal absolute P1–N1 amplitude of oABR (mean ± SEM) was greater for Chronos‐ES/TS than for Chronos (Mann–Whitney U‐test, P‐value ≤ 0.001).
Latency of oABR P1 as a function of radiant flux as in (B). Radiant flux was binned per 5 mW steps (horizontal error: ± SEM).
oABRs driven with varying stimulus duration (10 Hz, 38 mW, colors code the duration) for exemplary mice injected with AAV‐PHP.B‐Chronos (left) or AAV‐PHP.B‐Chronos‐ES/TS (right).
P1‐N1 amplitude as a function of stimulus duration as in (D) (normalized against the largest P1‐N1 oABR amplitude).
Latency of oABR P1 as a function of stimulus duration as in (E).
oABRs driven with varying stimulus rate (1 ms and 0.5 ms for 10–500 Hz and 500–1,000 Hz, respectively, 38 mW, colors code the stimulus rate) for exemplary mice injected with AAV‐PHP.B‐Chronos (left) or AAV‐PHP.B‐Chronos‐ES/TS (right).
P1‐N1 amplitude as a function of stimulus rate as in (G) (normalized against P1‐N1 oABR amplitude at 20 Hz).
Latency of oABR P1 as a function of stimulus rate as in (H): Chronos‐ES/TS enables responses up to at least 1,000 Hz. Dashed line indicates latencies data points obtained with a pulse duration of 0.5 ms.
latency were measured on the same animals. Animal count (
) is stated on bottom right of panels (B, E and H). Data are expressed as mean ± SEM.

