-
A
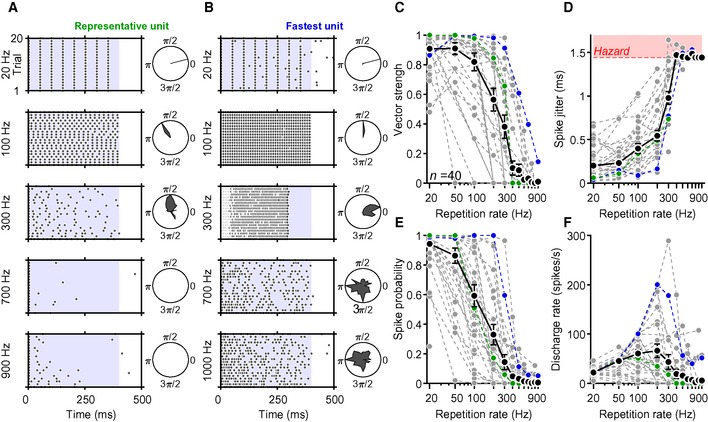
Raster plots showing spiking activity from a representative putative SGN (“unit”) in response to 400‐ms‐long trains of laser pulses (at 30 mW, 1 ms for 20–600 Hz, 500 μs for ≥ 700 Hz) recorded at five different stimulation rates over 20 repetitions. Polar plots to the right side of raster plots show synchronicity of firing relative to the cycle between two pulse onsets.
-
B
Same protocol and analysis of the “fastest unit” recorded, showing lower adaptation and firing even at very high stimulation rates.
-
C–F
Quantification of the vector strength (C), spike jitter (D), spike probability (E), and discharge rate (F) as a function of repetition rate of 40 putative SGNs (obtained from 6 mice). In panel (D), the red‐shaded area represents the hazard function obtained in response to simulated Poisson spike trains.
Data information: Black data points and lines show mean ± SEM; individual units are shown in gray. The units shown on panels (A and B) are shown in green and blue, respectively. Number of units tested for each repetition rate: 20 Hz: 40, 50 Hz: 25, 100 Hz: 24, 200 Hz: 26, 300 Hz: 21, 400 Hz: 20, 500 Hz: 21, 600 Hz: 18, 700 Hz: 18, 800 Hz: 19, 900 Hz: 21, 1,000 Hz: 19.

