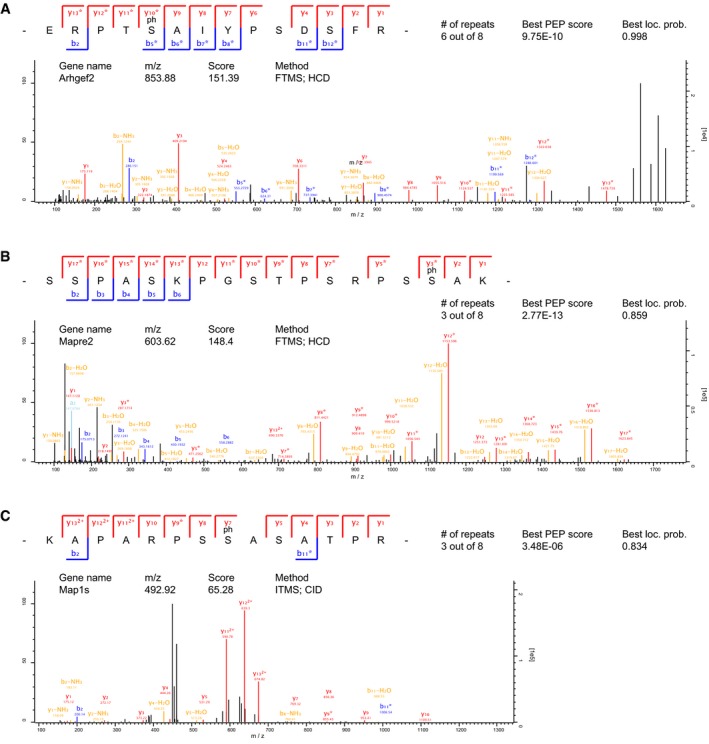
Figure EV1. MS2 spectra of CDKL5 substrates.

-
A–CBest identification spectra for ARHGEF2 (A), EB2 (B) and MAP1S (C) isolated by chemical genetic covalent capture for CDKL5 substrates. Sequences are determined by product ions of b‐ and y‐series after collision‐induced dissociation (CID) or higher‐energy C‐trap dissociation (HCD). Neutral loss of phosphoric acid generates a product ion series that corresponds only to those ions containing the phosphorylated residue (*). # of repeats represent the number of CDKL5 AS samples in which the specific phosphosite was identified. Only phosphosites never identified in KD samples were considered putative CDKL5 targets.
