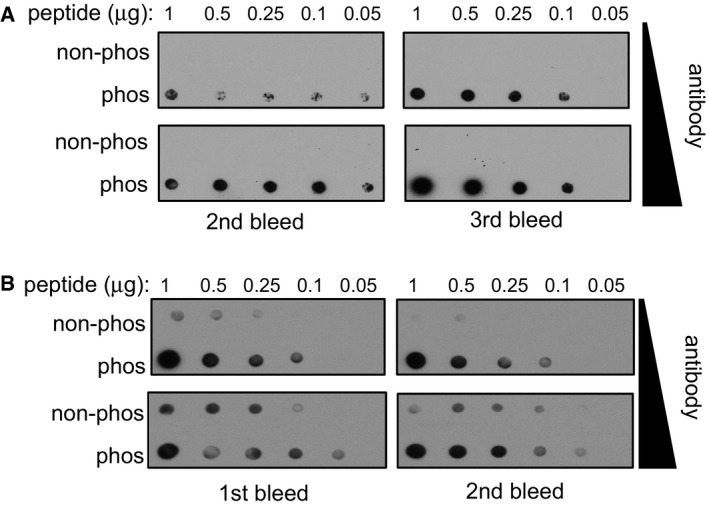
Figure EV1. Dot blot analysis of phospho‐specific antibodies.

- Dot blot analysis of the MAP1S pSer900 antibodies. Increasing amounts of MAP1S pSer900 phosphopeptide immunogen and non‐phosphopeptide equivalent were spotted onto nitrocellulose, and membrane was subjected to dot blotting with two different concentrations of affinity‐purified MAP1S pS900 antibodies (0.2 μg/ml for 18 h or 1 μg/ml for 1 h). Two different antibody bleeds were tested.
- Dot blot analysis of CEP131 pSer35 antibodies. Increasing amounts of CEP131 pSer35 phosphopeptide immunogen and non‐phosphopeptide equivalent was spotted onto nitrocellulose. After cross‐linking with glutaraldehyde (1% (v/v) in H2O for 10 min), the membrane was subjected to dot blotting with two different concentrations of affinity‐purified CEP131 pSer35 antibodies (0.2 μg/ml for 18 h or 1 μg/ml for 1 h). Two different antibody bleeds were tested.
Source data are available online for this figure.
