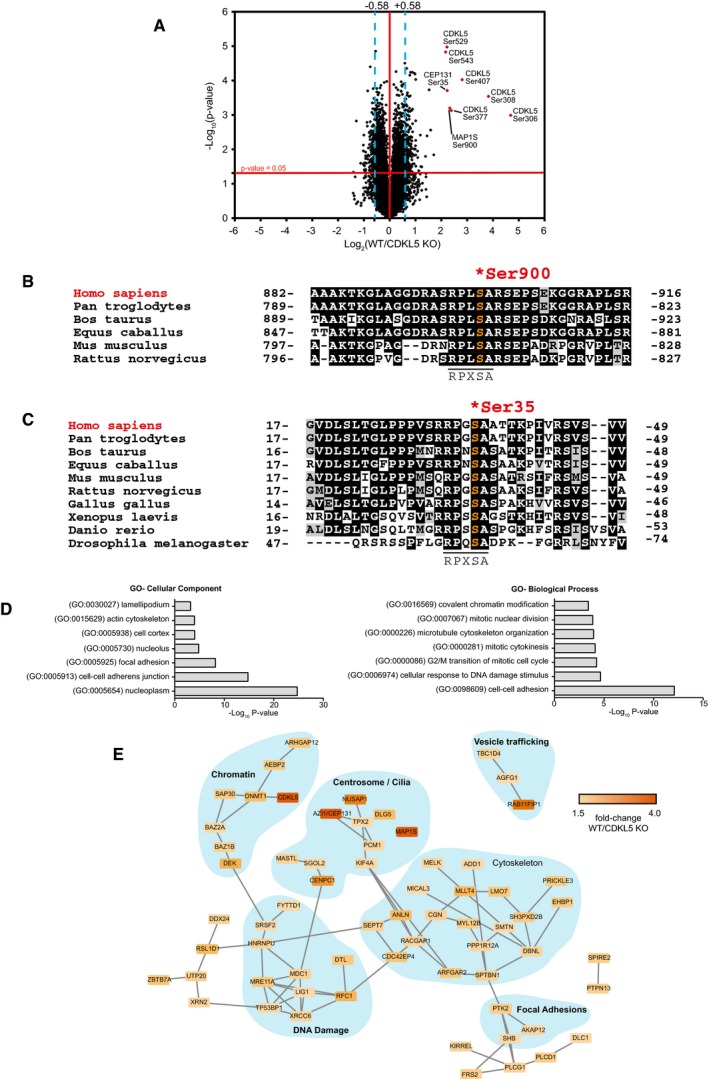
Figure 2. Identification of CDKL5 substrates in human cells.

-
AVolcano plot showing potential CDKL5 substrates. The horizontal cut‐off line represents a P‐value of 0.05, and the vertical cut‐off lines represent a log2 ratio of 0.58 (˜1.5‐fold) above which peptides were considered to differ significantly in abundance between CDKL5 KO cells expressing empty vector and CDKL5 KO cells expressing CDKL5. The mass spectrometry proteomics data for this figure have been deposited to the ProteomeXchange Consortium via the PRIDE partner repository (Jarnuczak & Vizcaino, 2017) with the dataset identifier PXD009374.
-
B, CSequence alignment of the Ser900 phosphorylation site in MAP1S (B) and the Ser35 phosphorylation site in CEP131 (C), in the species indicated.
-
DGene Ontology (GO) term enrichment of phosphopeptides that are more abundant in CDKL5‐expressing cells compared to knockout cells.
-
EString database network analysis of proteins which harbour phosphosites up‐regulated in CDKL5‐expressing cells compared to knockout cells. These are part of protein complexes involved in a wide range of biological functions.
