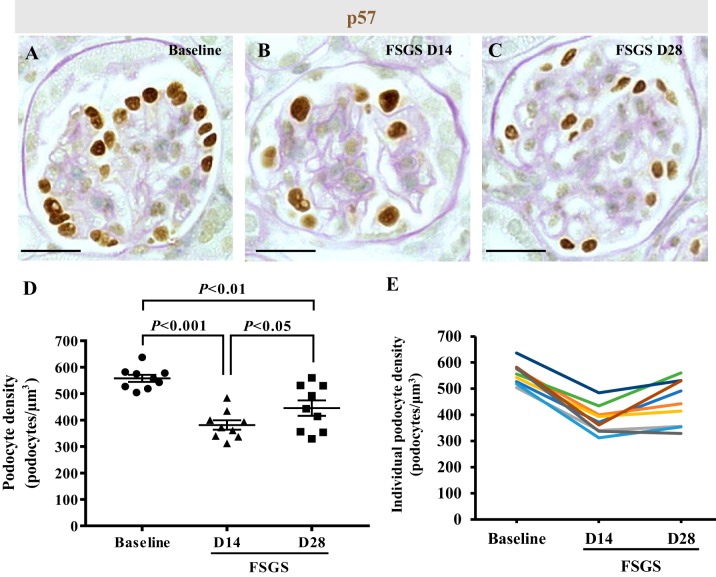
Fig. 6.
Podocyte depletion in neural/glial antigen 2 (NG2) reporter mice with experimental focal segmental glomerulosclerosis (FSGS). A–C: p57 immunohistochemistry was performed to measure podocyte density in NG2-CreER tdTomato mice and counterstained with periodic acid-Schiff to visualize glomeruli better. D: graph shows that podocyte density (number of podocytes/µm3) significantly decreased at FSGS D14 compared with baseline (P < 0.001). Although podocyte density was still lower at FSGS D28 compared with baseline (P < 0.01), there was partial recovery at FSGS D28 compared with FSGS D14 (P < 0.05). E: line graph showing podocyte density for individual mice, each represented by a different color. Original magnification, x400 (A–C). Scale bar, 20 μm. D, day.

