Fig. 1.
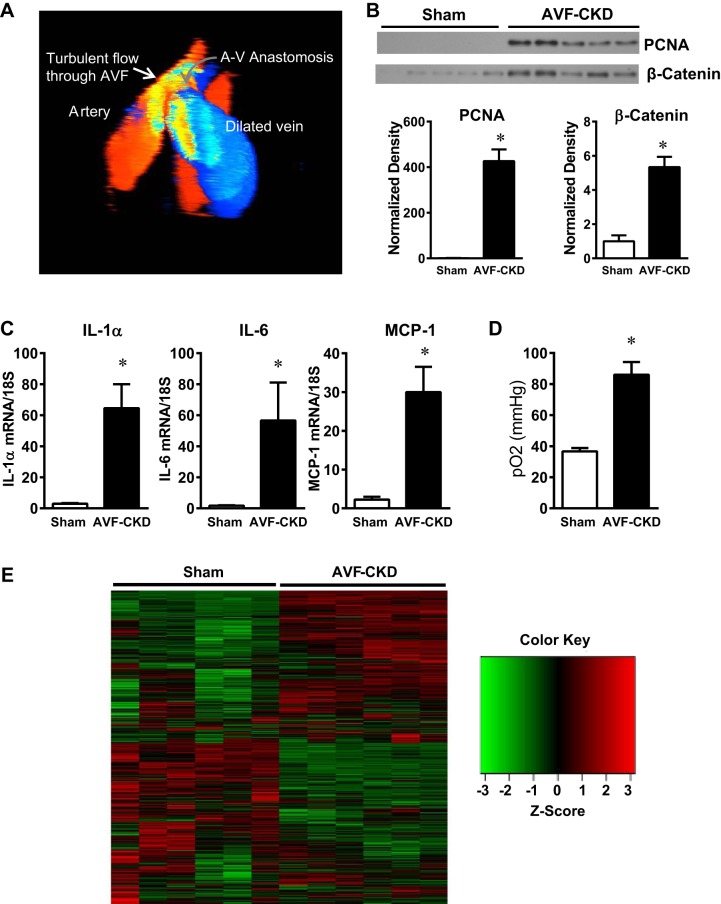
Stressors in the vein in the arteriovenous fistula (AVF)-chronic kidney disease (CKD) model. A: 3-dimensional color Doppler ultrasound image of the AVF in the AVF-CKD group. Red and blue indicate cranial and caudal blood flow in the AVF artery and vein, respectively. Oscillatory flow at the anastomosis is revealed by the yellow mosaic pattern, and a mixture of caudal (blue) and cranial-directed (red) flow is seen in the dilated AVF vein. A-V, arteriovenous. B: Western blot analysis of proliferating cell nuclear antigen (PCNA) and β-catenin expression in sham veins and the vein of the AVF-CKD model and normalized expression at 1 wk. Values are means ± SE; n = 5 in each group. *P < 0.05. C: IL-1α, IL-6, and monocyte chemoattractant protein 1 (MCP-1) mRNA expression in sham veins and in the vein of the AVF-CKD model at 1 wk. Values are means ± SE; n = 9 sham and 10 AVF-CKD. *P < 0.01. D: Po2 in blood from sham veins and the vein of the AVF-CKD model after AVF/sham surgery. Values are means ± SE; n = 6 in each group. *P < 0.05. E: heat map of RNA-sequencing analysis of sham veins and the vein of the AVF-CKD model at 1 wk. Map comprises 2,427 genes with a false discovery rate of <0.05 and an absolute log2 fold change of ≥2. Green-to-red coloring was calculated from each sample’s reads per kilobase million (RPKM) value for each gene and then transformed to z scores. Significant transcriptomic landscape differences distinguish each group; unsupervised clustering with the MeV software perfectly separated the sham vein samples from the AVF-CKD samples.

