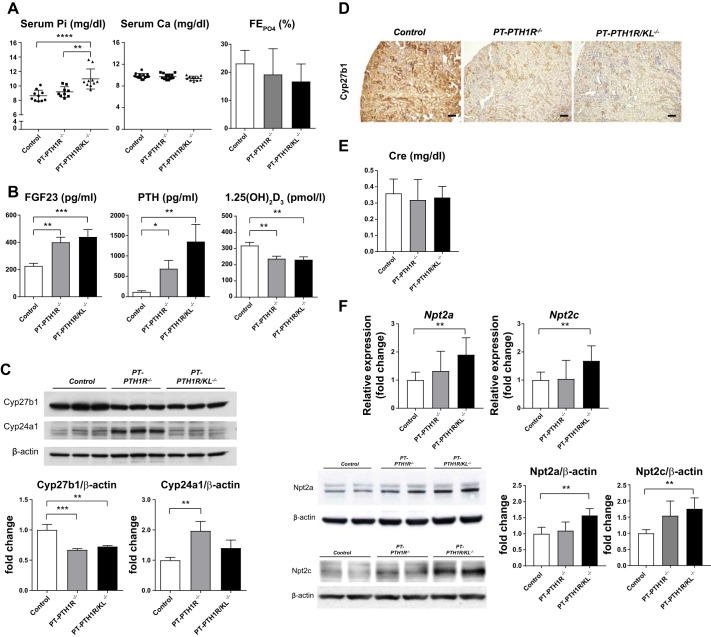
Fig. 2.
Characterization of PT-PTH1R−/− mice and PT-PTH1R/KL−/− mice. A: Serum and urinary biochemistry. Serum calcium levels (n = 11–14), phosphate levels (n = 9–10), and fractional phosphate excretion (n = 6–9) were measured in Control mice, PT-PTH1R−/− mice, and PT-PTH1R/KL−/− mice. B: regulatory factors iFGF23 (n = 9–13), parathyroid hormone (PTH) (n = 13–16), and 1,25(OH)2D3 (n = 10–13) were measured in Control mice, PT-PTH1R−/− mice, and PT-PTH1R/KL−/− mice. C: Cyp27b1 and Cyp24a1 protein expression from isolated proximal tubules of Control mice, PT-PTH1R−/− mice, and PT-PTH1R/KL−/− mice were determined by Western blot analysis (n = 3). D: representative images of Cyp27b1 immunostaining are shown in the kidney of PT-PTH1R/KL−/− mice and Control mice (scale bar = 100 µm). E: serum creatinine levels were measured in Control mice, PT-PTH1R−/− mice, and PT-PTH1R/KL−/− mice (n = 9–15). F: relative mRNA levels of renal transcripts (Npt2a and Npt2c) were measured by quantitative PCR in Control mice, PT-PTH1R−/− mice, and PT-PTH1R/KL−/− mice (n = 5–7). Npt2a and Npt2c protein expression were detected by Western blot analysis (n = 4). Brush border membrane was isolated from the kidney of Control mice, PT-PTH1R−/− mice, and PT-PTH1R/KL−/− mice. β-actin was used as internal control. Values of P < 0.05 were considered statistically significant. *P < 0.05, **P < 0.01, ***P < 0.001, and ****P < 0.0001. Data represent the means ± SD.

