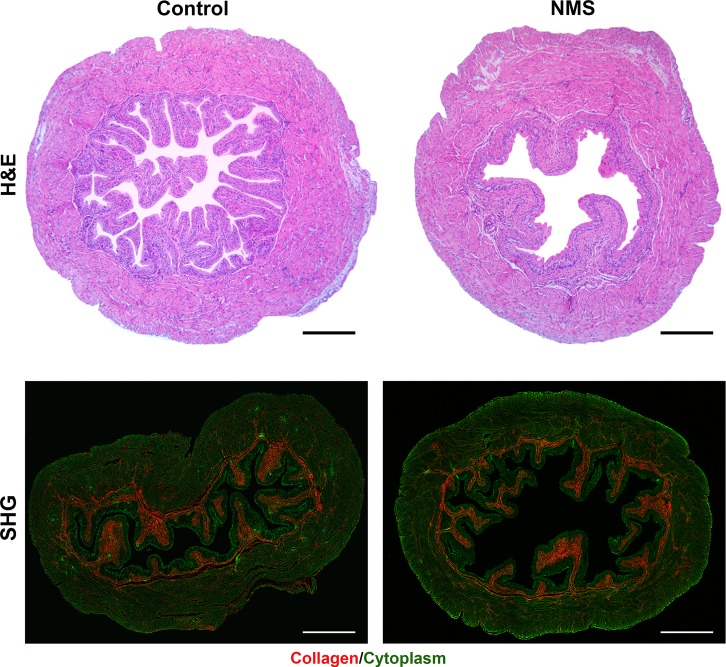
Fig. 5.
Histological analysis of bladders. Representative images of H&E staining (top) and SHG (bottom) of bladders from control (left) or NMS (right) mice at 6 wk old. Collagen fibers and cytoplasm were shown in pseudo-red and pseudo-green in SHG images, respectively. Scale bars = 500 μm. H&E, hematoxylin-eosin; NMS, neonatal maternal separation; SHG, second harmonic generation.

