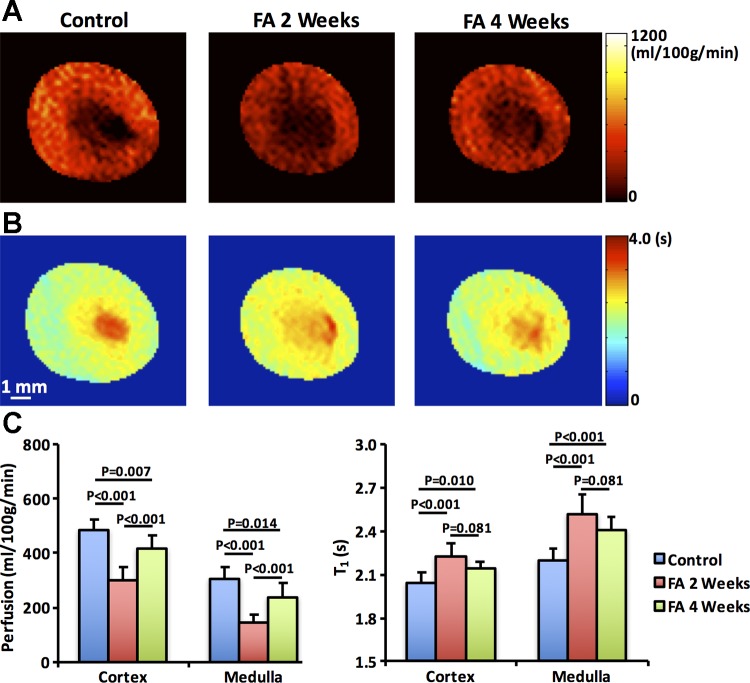
Fig. 3.
Renal perfusion and T1 by flow-sensitive alternating inversion recovery sequence with rapid acquisition with relaxation enhancement. Representative renal perfusion (A) and T1 (B) maps of control (n = 5) and folic acid (FA) mice at 2 (n = 10) and 4 (n = 5) wk after treatment. The measured renal perfusion and T1 (C) in renal cortex and medulla. Biphasic changes were observed in both renal perfusion and T1. A marked decrease in renal perfusion was observed at 2 wk, followed by a mild recovery at 4 wk. Renal T1 showed a dramatic increase at 2 wk but a tendency of decrease at 4 wk. The elevated T1 indicates increased fluid content because of tubular dilation in FA-treated mouse kidneys. Statistical comparison was performed using one-way analysis of variance followed by Tukey’s post hoc analysis.

