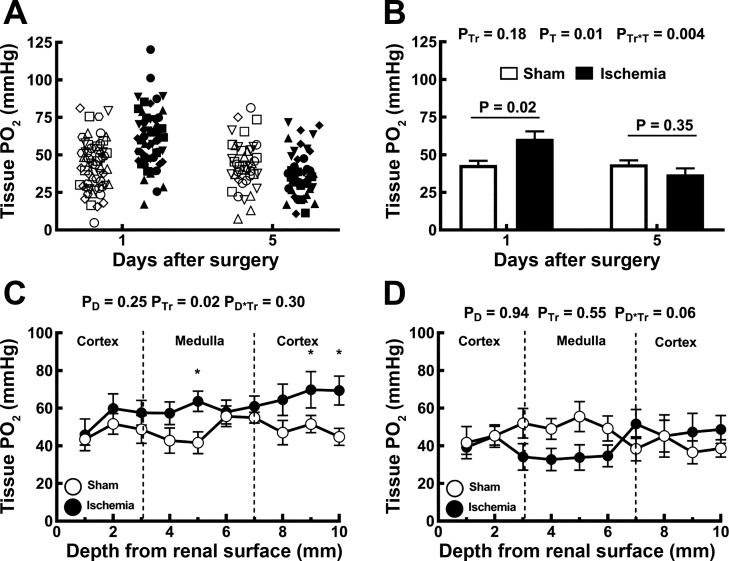
Fig. 2.
Assessment of tissue Po2 by Clark electrode. The electrode was first inserted 2 mm into the cortex at six random sites across the left kidney. A: multiple measurements are shown for each rat, with the various rats represented by different symbols. Closed symbols represent rats subjected to renal ischemia (n = 9 at 24 h and n = 8 at 5 days), whereas open symbols represent rats subjected to sham ischemia (n = 10 at 24 h and n = 7 at 5 days). B: measurements of cortical tissue Po2 for each rat were averaged and are presented as between-rat means ± SE. In B, PTr, PT, and PTr*T are the outcomes of a two-way analysis of variance (ANOVA) with factors treatment (Tr) and time (T). P values above each pair of columns and error bars show the outcomes of Student’s unpaired t-test conservatively adjusted using the Dunn-Sidak correction with k = 2 to account for the fact that comparisons were made at 24 h and 5 days. C and D: a tissue Po2 profile with depth was established by advancing the electrode from the cortical surface at 1-mm increments, up to 10 mm into the left kidney either 24 h (C) or 5 days (D) following recovery from either ischemia or sham ischemia. Symbols and error bars are the means ± SE for rats subjected to either an hour of sham (○) or bilateral renal ischemia (●). In C and D, PD, PTr, and PD*Tr are the outcomes of two-way repeated-measures ANOVA with factors depth (D) and treatment. *P ≤ 0.05 and is the outcome of Student’s unpaired t-test without correction for multiple comparisons.

