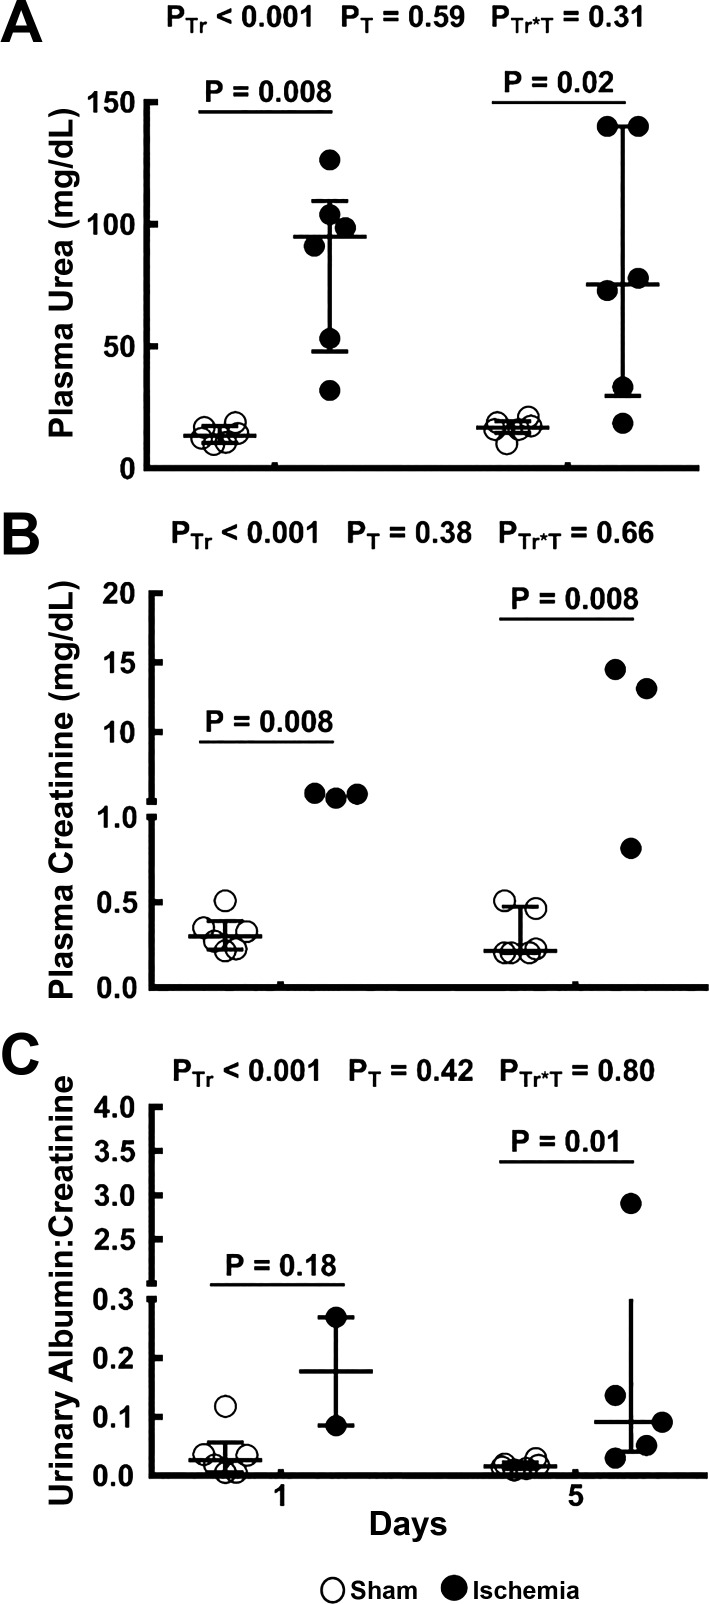
Fig. 8.
Indicators of renal dysfunction. Plasma concentrations of urea (A) and creatinine (B) and the urinary albumin-to-creatinine ratio (C) are shown for rats 24 h and 5 days after sham ischemia (○) or bilateral renal ischemia (●); n = 6 per group. Values are expressed as medians (25th percentile, 75th percentile). Comparisons were performed using the Mann-Whitney U-test. Because comparisons were made at two time points, P values were conservatively adjusted using the Dunn-Sidak method with k = 2. PTr, PT, and PTr*T are the outcomes of two-way analysis of variance on ranking with the factors treatment (Tr) and time (T).

