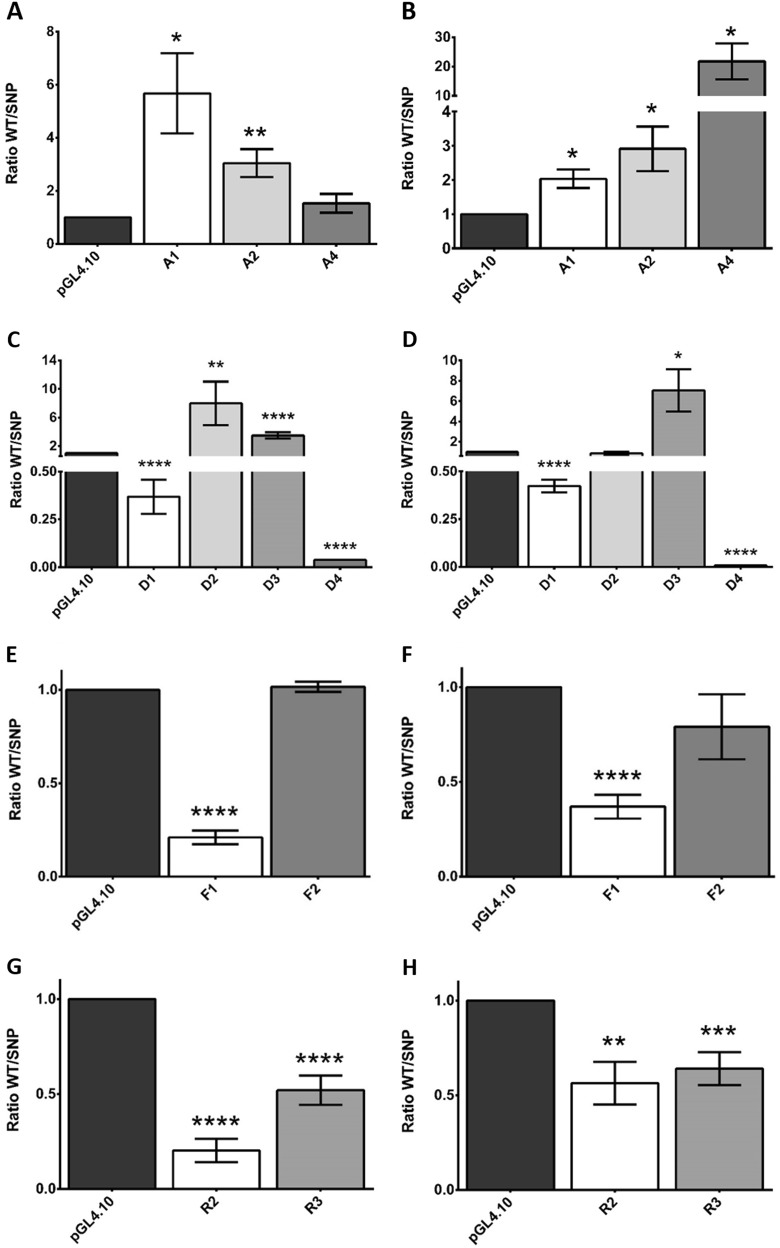
Fig. 1. Results of the luciferase assay.
using both 100 ng (a, c, e, g) and 250 ng (b, d, f, h) of DNA, of the selected SNPs in each gene: AKT1 (a, b), DDIT4 (c, d), FCHSD1 (e, f), and RPTOR (g, h). For each SNP the ratio of the activity measured with the Allele 1 vs. Allele 2 is showed. Measured activities were normalized using empty pGL4.10 as a control vector. At least three independent transfection experiments were performed and each luciferase assay was carried out in triplicates. *p-value < 0.05; **p-value < 0.01, ***p-value < 0.001, ****p-value < 0.0001

