-
A
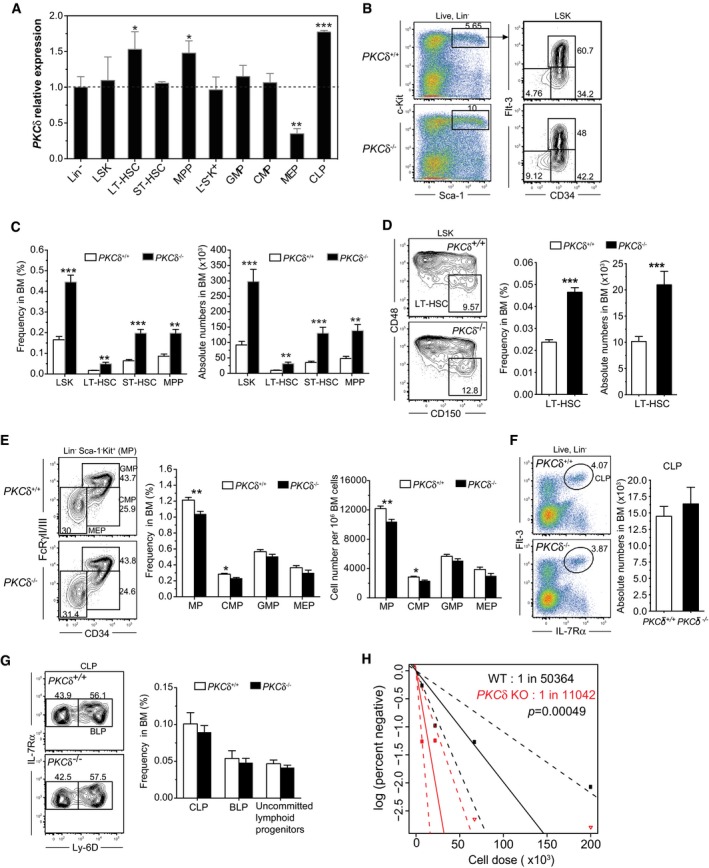
Quantitative real‐time PCR analysis of PKCδ mRNA levels in FACS‐sorted Lin−, LT‐HSC, ST‐HSC, MPP, L−S−K+, GMP, CMP, MEP, and CLP subsets from C56BL/6 wild‐type (6‐ to 9‐week‐old) mice bone marrow. Levels of PKCδ expression were normalized to an internal control gene (β‐actin). Expression of PKCδ is shown relative to Lineage negative (Lin−) cells whose expression was arbitrarily set to 1 (n = 4 mice analyzed for each population).
-
B, C
(B) FACS plots depict the percentage of live, Lin−Sca1+c‐Kit+ (LSK) (left panel), and primitive CD34−Flt3−, CD34+Flt3−, and CD34+Flt3+ HSPCs among LSK cells (right panel). (C) Bar charts show the average frequency (left) and absolute number (right) ± SEM of the indicated populations, analyzed from 2 femurs and 2 tibias per mouse (n = 10 mice analyzed for each genotype).
-
D
FACS plots show percentages of “SLAM code” based stem and progenitor cells in the LSK population. Bar graphs show the average frequency (left) and absolute numbers (right) ± SEM of LT‐HSC per 2 femurs and 2 tibias. (n = 10 mice analyzed for each genotype).
-
E
FACS plots illustrate gating and frequencies of myeloid progenitors (MP), granulocyte–monocyte progenitor (GMP), common myeloid progenitor (CMP), and megakaryocyte–erythroid progenitor (MEP) population. Bar graphs show the frequencies (left) and absolute numbers (right) of L−S−K+ MP and GMP, CMP, and MEP populations in the BM of WT (n = 12) and PKCδ KO (n = 12).
-
F
FACS plots illustrate the gating and percentages of common lymphoid progenitors (CLP). Bar graph shows the absolute number of CLPs per 2 femurs and 2 tibias (n = 5 mice for each genotype).
-
G
FACS plots illustrate the percentages of uncommitted lymphoid progenitors (Lin− IL‐7Rα+Flt3+Ly‐6D−) and B lymphoid progenitors (BLP). Bar graph represents the average frequencies of CLPs, BLP, and uncommitted lymphoid progenitors in total BM (n = 5 mice per genotype).
-
H
Limiting dilution analysis (LDA) demonstrates an increased frequency of long‐term repopulating HSCs in PKCδ KO BM (solid red lines) compared with WT BM (black solid lines). Engraftment data shown at 14 weeks post‐BMT. Plots depict the percentages of recipient mice containing < 1% CD45.2+ blood nucleated cells. Dotted lines represent the 95% confidence interval of the same (P = 0.0005).
Data information: All data are presented as mean ± SEM. *
< 0.001 by with one‐way ANOVAs with Sidak's multiple comparisons test (A) or two‐tailed Student's unpaired
‐test (C‐G) analysis for comparison of WT to PKCδ KO mice. Overall, test for differences in stem cell frequencies between WT to PKCδ KO mice was determined with likelihood ratio test of single‐hit model (H).

